12 New Futura Broker Indicators and What Each One Does
Squeeze Momentum, Order Blocks, Fair Value Gaps, SuperTrend AI, VWAP and more: the 12 new Futura Broker chart indicators, explained.
We added 12 new technical indicators to the Futura Broker chart in May 2026. They're already in the indicators menu, ready to apply to any asset and timeframe — from fanned-out moving averages to Smart Money concepts (Order Blocks, Fair Value Gaps) and a SuperTrend that uses AI clustering to pick the best parameter on its own.
Below is what each one does, the default parameters, and how to read the signal. No promise of profit: an indicator is a tool for reading context, not a crystal ball — what changes is the quality of your decision, not a guaranteed outcome.
Where to find them
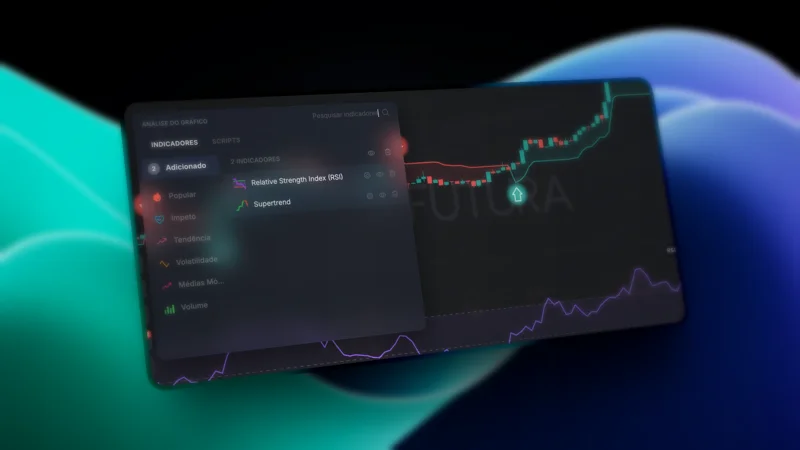
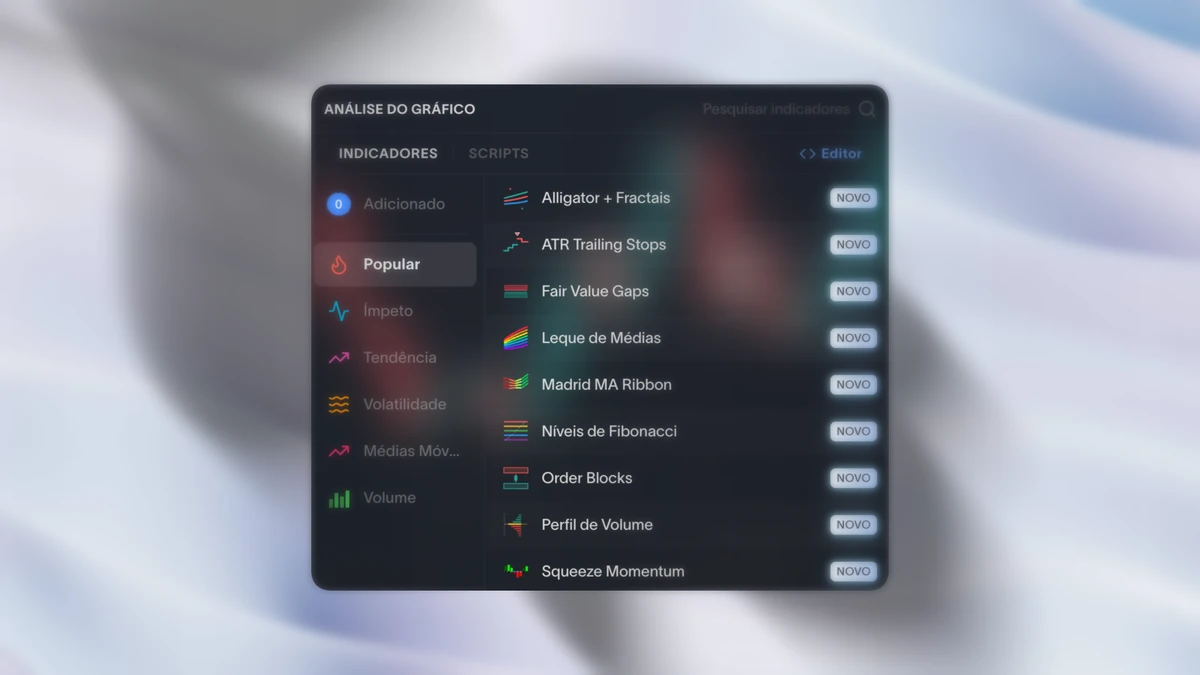
On the chart, open the Indicators menu (the indicators icon in the top bar). The 12 below appear in the list alongside the ones that already existed — just click to apply and adjust the parameters in each one's settings panel. If you've never applied an indicator to the chart, start with the how to use indicators on the chart tutorial.
Moving averages and trend
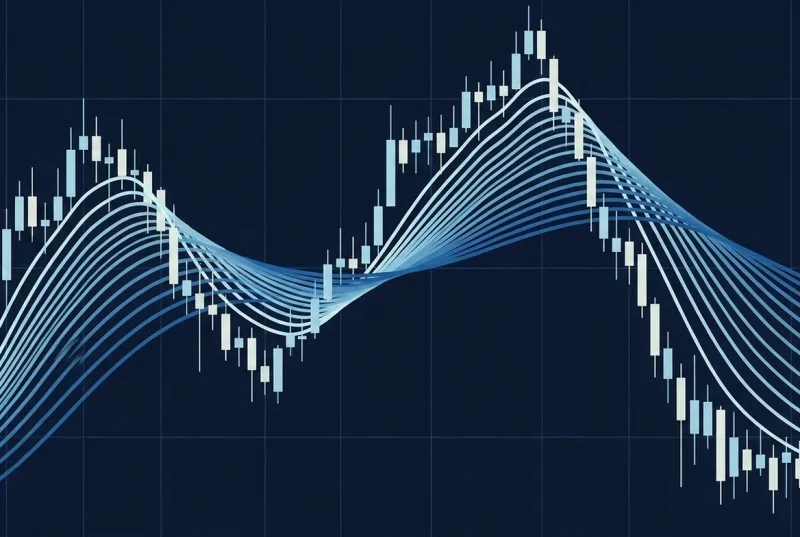
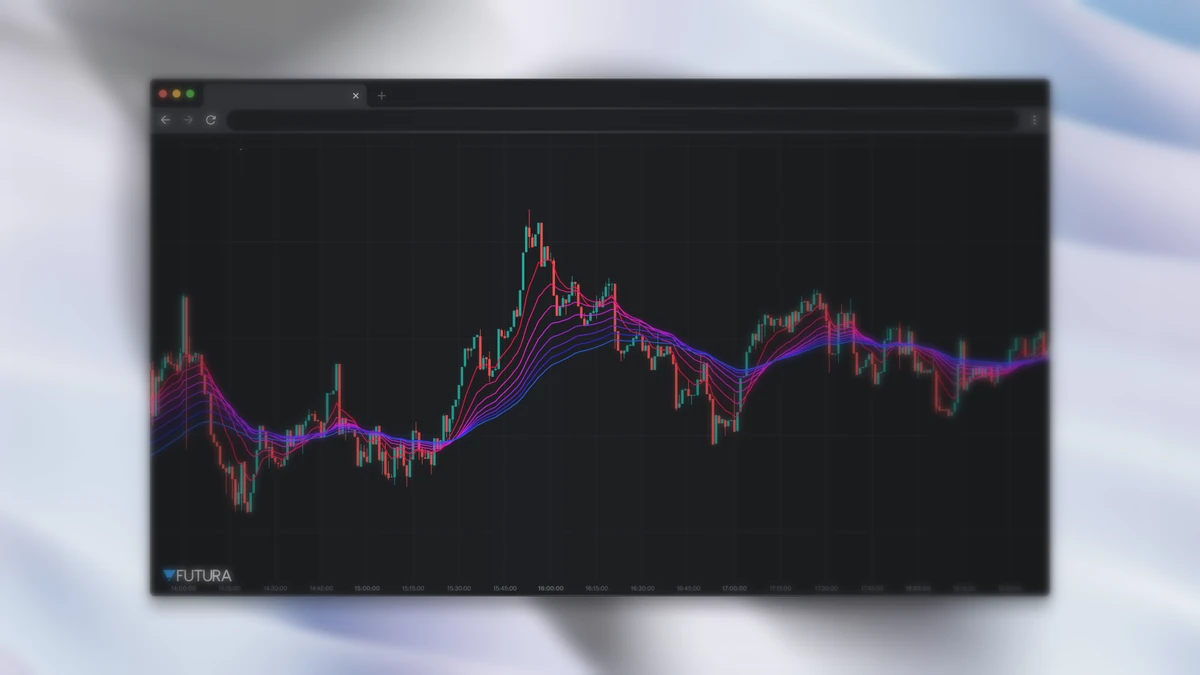
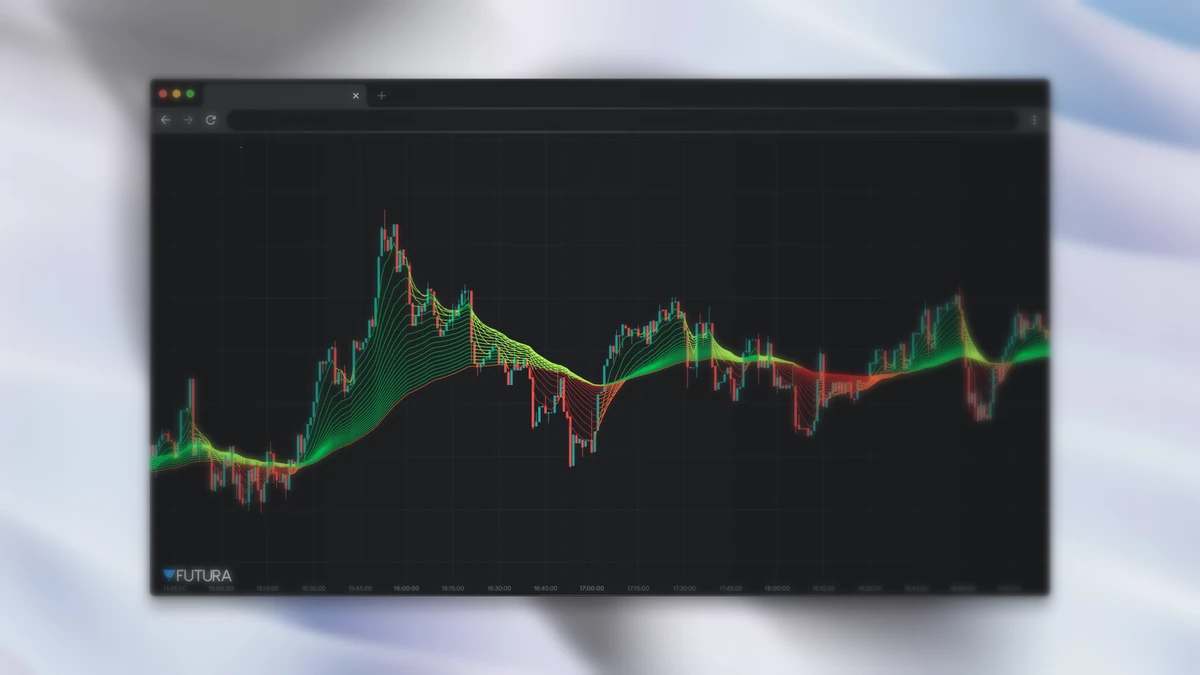
Moving Average Fan (MA Ribbon)
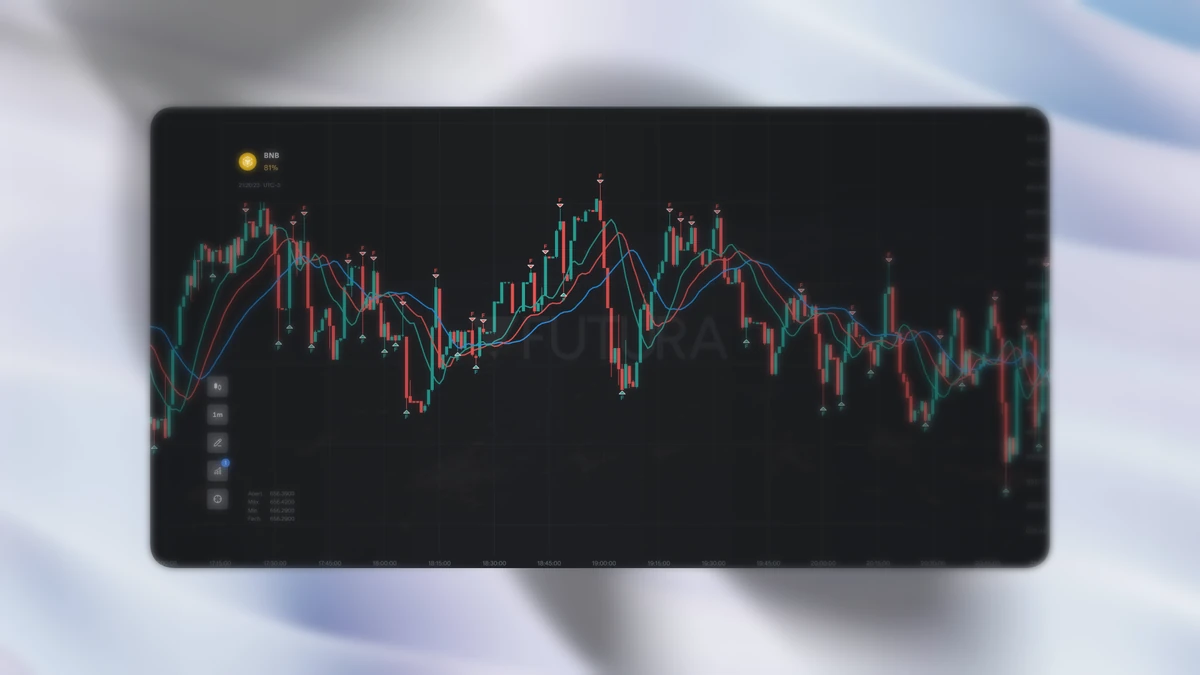
Plots 8 EMAs in parallel with gradient colors, creating a fan effect. When the lines are compressed, the market is consolidating or undecided; when they fan out, there's a strong trend — and the direction they open in is the direction of the trend.
Default parameters: 8 EMAs, periods from 10 to 80.
Madrid MA Ribbon
Krzysztof Madrid's version: 20 EMAs (periods from 5 to 100) over an EMA(100) used as the baseline. Each line changes color across 4 states — dark green (above the baseline and rising = strong uptrend), light green (above but falling = weak uptrend), dark red (below and falling = strong downtrend), and light red (below but rising = weak downtrend). The gradual color shift anticipates trend reversals.
Default parameters: 20 EMAs (5 to 100), baseline EMA(100).
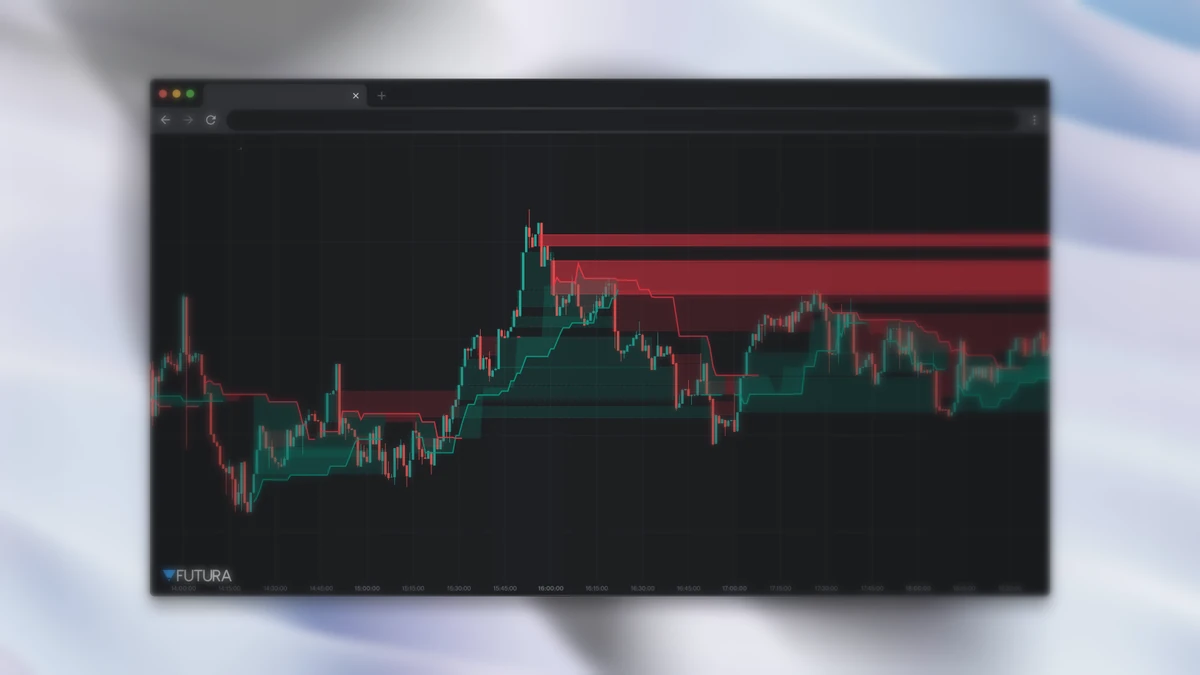
ATR Trailing Stops
Dynamic trailing stop based on ATR. The line is green below the price in an uptrend (acting as support) and red above in a downtrend (acting as resistance). When the price crosses the line, it changes color and an arrow marks the entry (buy) or exit (sell) point.
Default parameters: ATR period 14, multiplier 2.5, RMA smoothing.
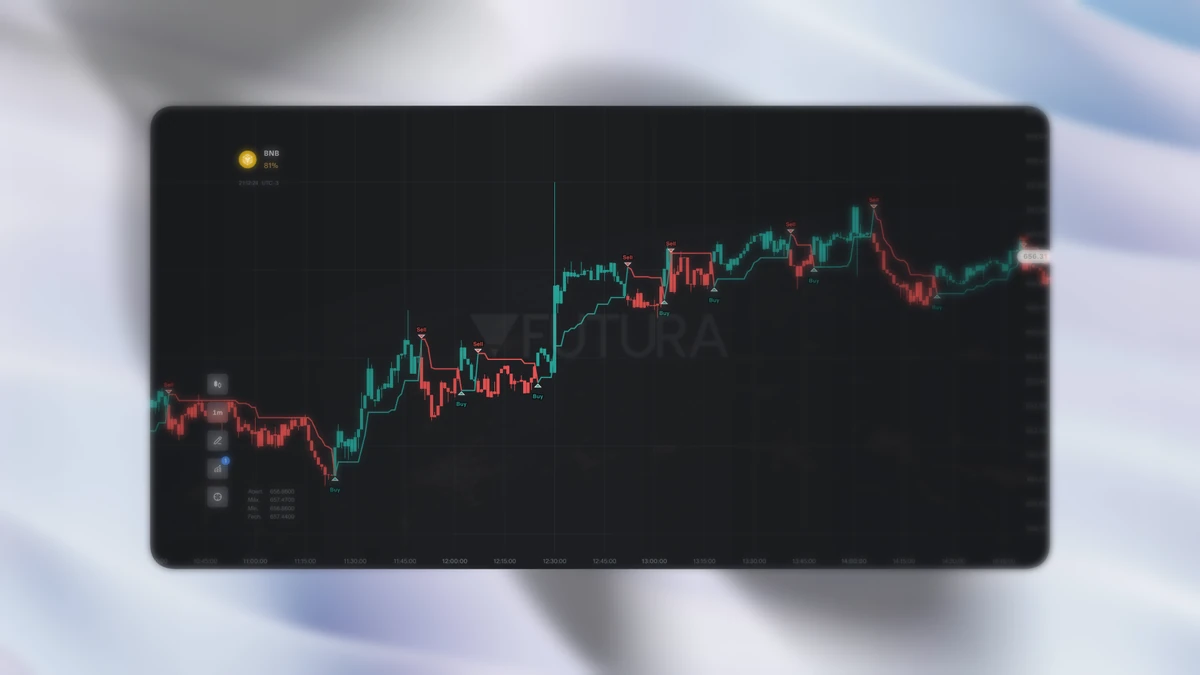
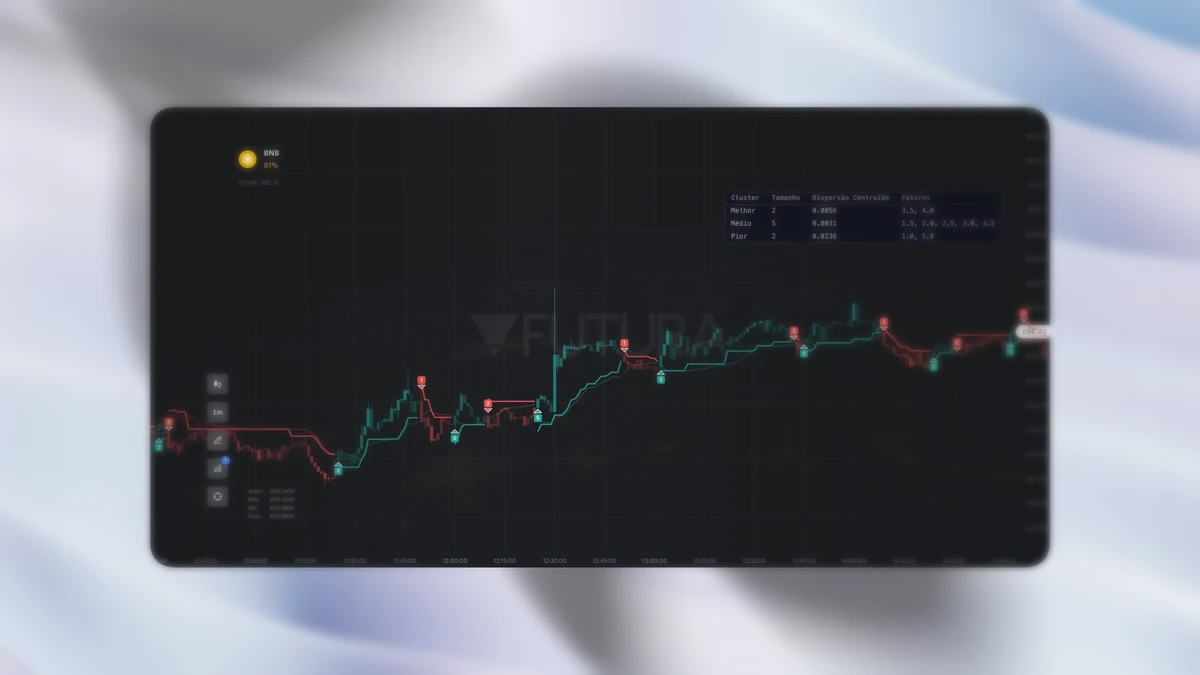
SuperTrend AI
SuperTrend with AI clustering (LuxAlgo). Instead of a single ATR factor, it tests several at once (1 to 5, step 0.5 by default), measures the performance of each, and uses K-means to group them into 3 clusters: Best, Average, and Worst. The final factor is the average of the chosen cluster (default Best). It plots the trailing stop, a performance-smoothed AMA line, and Buy/Sell arrows with a score from 0 to 10 indicating the signal quality.
Default parameters: ATR factors 1–5 (step 0.5), Best cluster.
Momentum and volatility
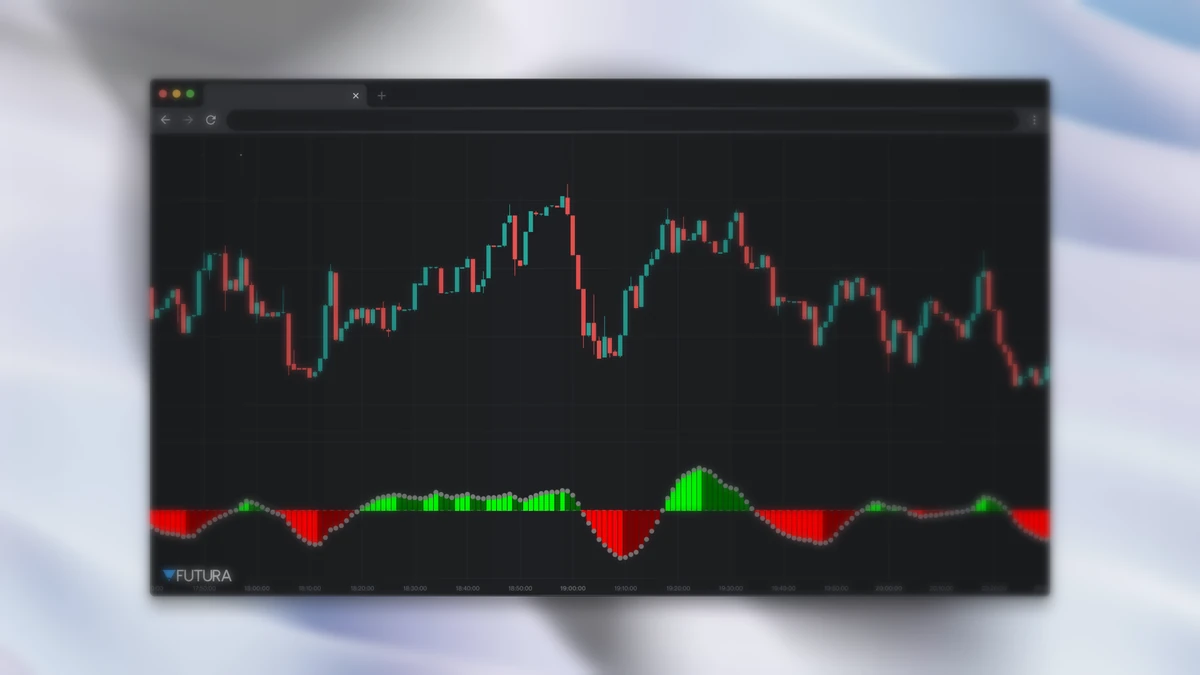
Squeeze Momentum
By LazyBear, based on the book Mastering the Trade (John F. Carter). It combines Bollinger Bands and Keltner Channels to detect volatility compression and expansion. When the Bollinger Bands move inside the Keltner Channels (squeeze ON — black dot), the market is consolidated and about to expand; when they break out (squeeze OFF — gray dot), the expansion has begun. The histogram uses linear regression to show momentum: lime (strong uptrend accelerating), dark green (uptrend decelerating), red (strong downtrend accelerating), maroon (downtrend decelerating). It's widely used in scalping and binary options.
Alligator + Fractals
Bill Williams' Alligator: 3 smoothed moving averages (SMMA) over the median price (H+L)/2, with an offset — Jaw (SMMA 13, shift +8, blue), Teeth (SMMA 8, shift +5, red), and Lips (SMMA 5, shift +3, green). When the three fan out in sequence, the "alligator" is awake and signals a strong trend; intertwined, they signal a ranging market. Combined with Fractals (5-bar pivots), it generates reversal arrows: ▼ at a top and ▲ at a bottom.
Price structure
Fibonacci Levels
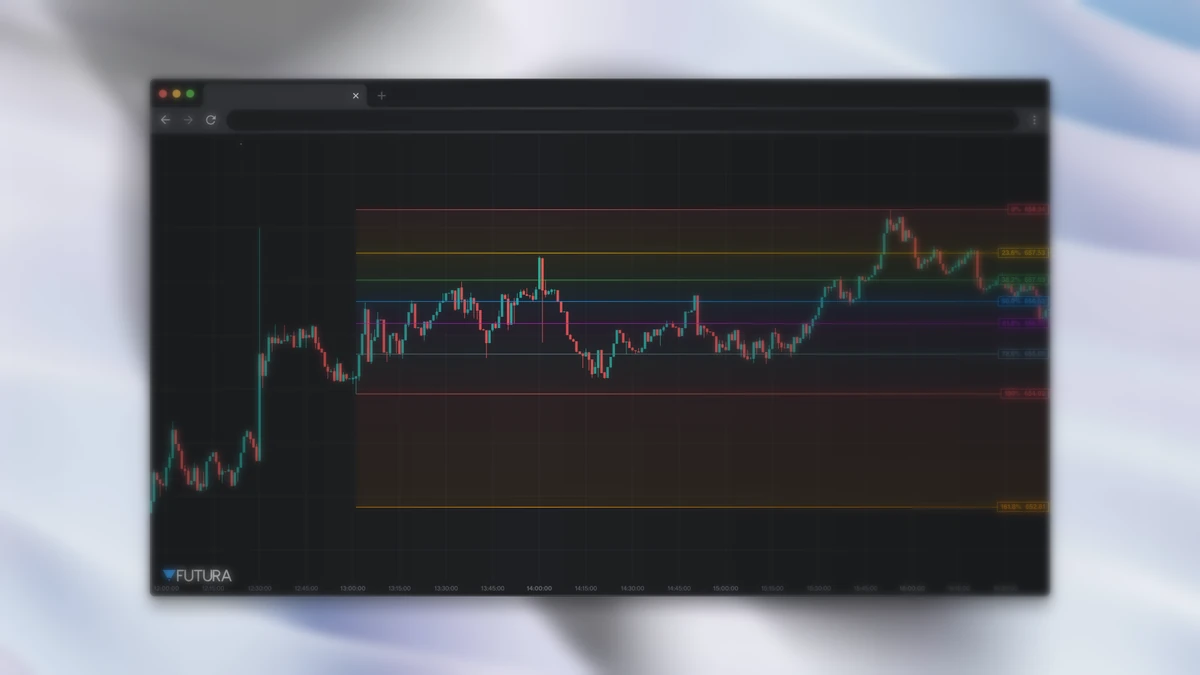
Automatic retracement: detects the most recent swing high/low within a window of candles and plots the retracement levels (0%, 23.6%, 38.2%, 50%, 61.8%, 78.6%, 100%) plus the 161.8% extension. Each level is a horizontal line with the percentage and the price — useful for mapping support and resistance during pullbacks.
Default parameter: 100-candle window.
Zig Zag
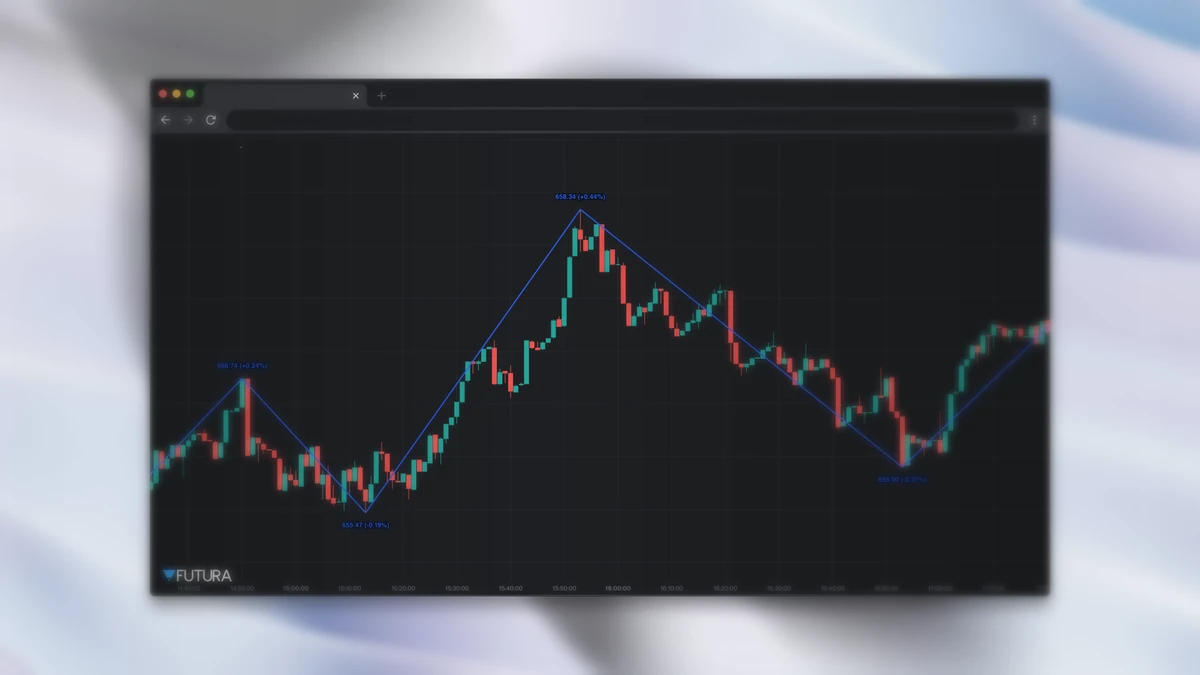
Connects the high and low pivots that exceed a percentage deviation threshold, filtering out noise smaller than that limit and leaving only the significant moves. It shows the price and the % change of each pivot. It's a foundation for Elliott Wave counting and structural analysis.
Default parameters: 5% deviation, 10-candle pivot legs.
Smart Money Concepts
Order Blocks
Detects zones where institutions likely placed large orders. After a bullish displacement candle (range ≥ ATR × multiplier), the last preceding bearish candle becomes a demand zone (green) — an upward rejection is expected when the price returns. The reverse forms the supply zone (red). Order Blocks that have already been mitigated (the price crossed and closed beyond the zone) appear with reduced opacity and a dashed border.
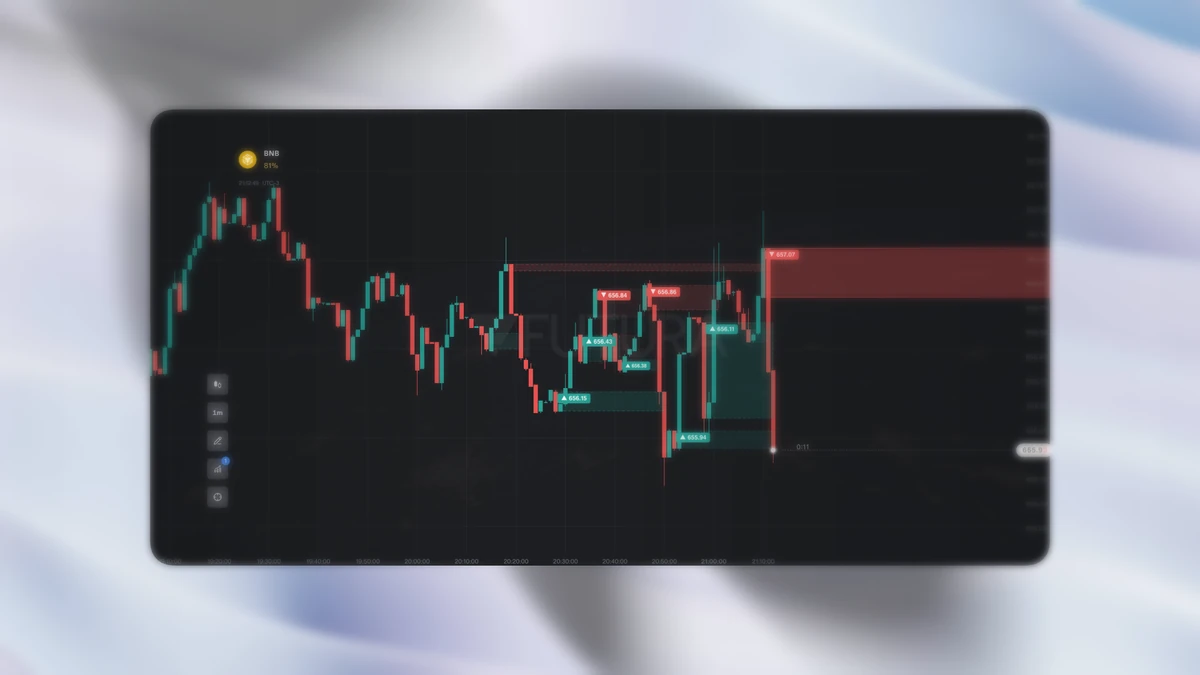
Fair Value Gaps
Detects imbalances across 3 consecutive candles — when the middle candle moves strongly enough to leave a gap uncovered by its neighbors. A Bullish FVG appears when the high of two candles back is below the low of the current candle; the price is expected to come back to fill the gap, acting as support (and the bearish analog). Together with Order Blocks, it's the central setup of Smart Money Concepts.
Volume
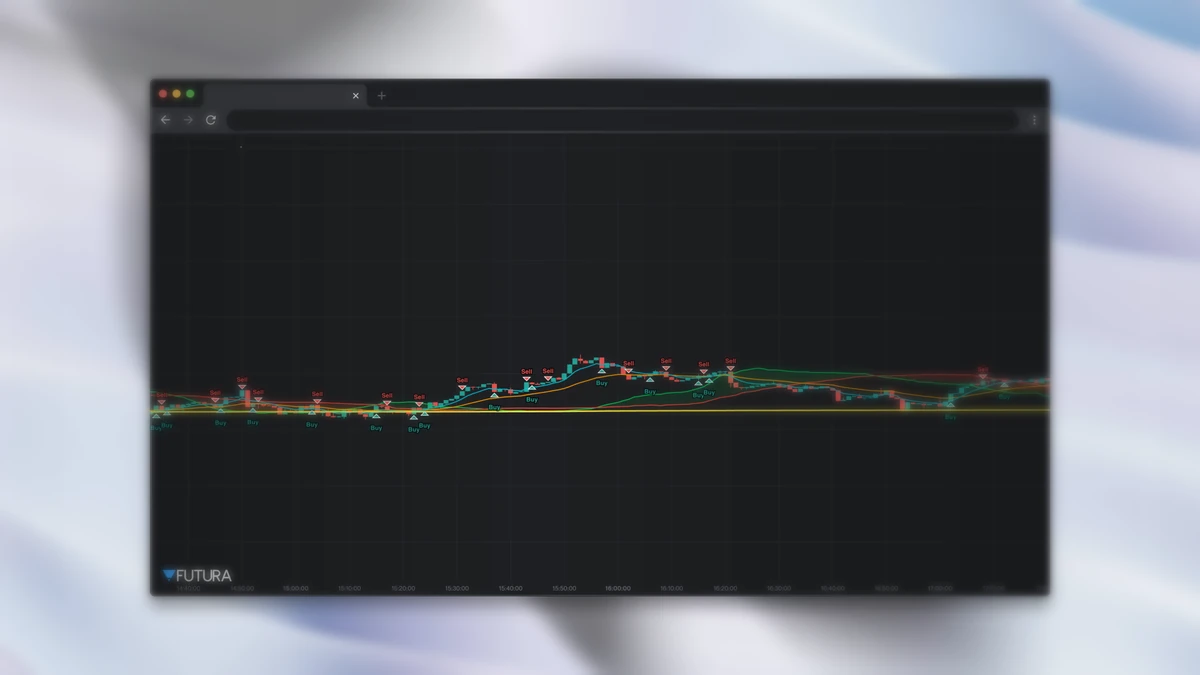
VWAP / MVWAP / EMA
By DerrickLaFlame: combines the daily cumulative VWAP (resets every UTC session), a smoothed MVWAP, two EMAs, and a volume-weighted cloud to generate Buy/Sell signals. A buy signal appears when EMA1 ≥ MVWAP and EMA2 ≥ MVWAP and VWAP ≥ MVWAP, with an RSI filter between 51 and 65 to avoid entering in overbought territory. On assets without real volume, it uses range × 1M as a proxy.
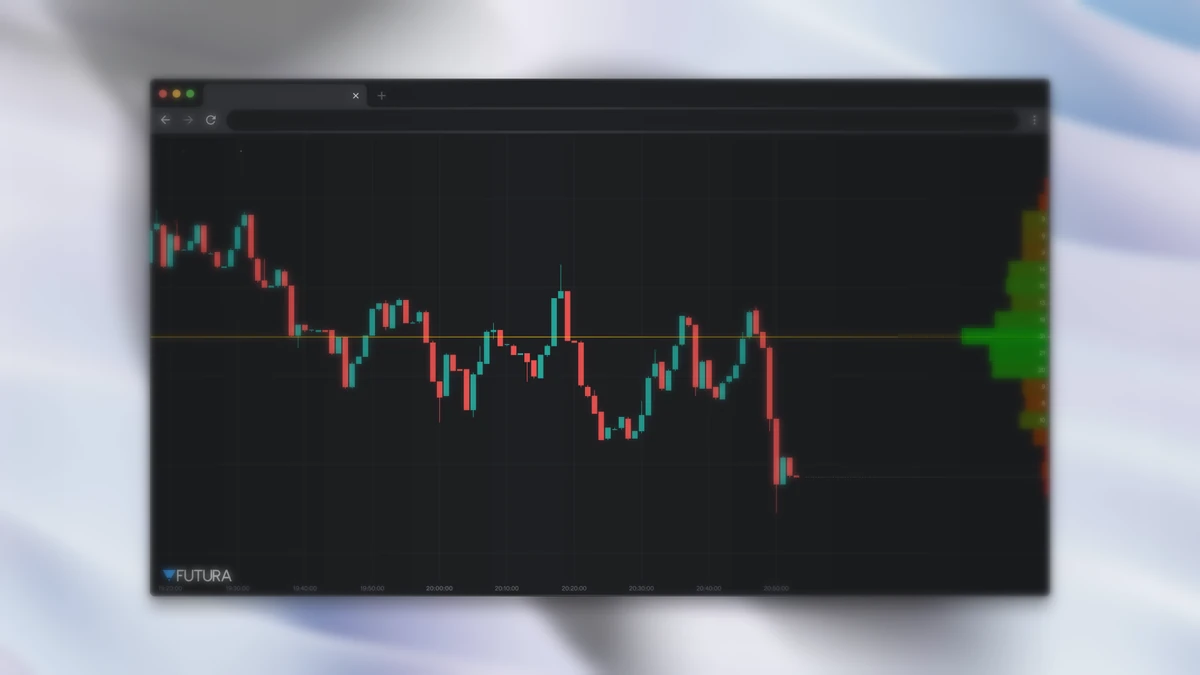
Volume Profile
Shows the horizontal distribution of volume by price range — unlike traditional volume, which is by time. It splits the range into bands and accumulates the volume of each candle. The POC (Point of Control) is the highest-volume band and tends to act as a magnet for price; the Value Area (default 70%) is the range where 70% of the volume was traded. A classic concept from order flow and institutional tape reading.
How to use them in practice
No indicator works on its own. The most consistent approach is to combine reading context (trending or ranging — Moving Average Fan, Madrid Ribbon, Alligator), a trigger (Squeeze Momentum, SuperTrend AI, ATR Trailing Stops), and levels (Fibonacci, Order Blocks, Fair Value Gaps, Volume Profile) to confirm entry and exit.
All 12 are available now in the indicators menu, with the default parameters already calibrated and adjustable. Open an asset, apply what makes sense for your setup, and test on a demo account before trading for real.
If you want to go beyond the ready-made indicators, you can create your own with AI by describing the strategy in plain English. Don't have an account yet? Open yours and test everything on a demo account.