Binary options indicators: a practical how-to guide
Learn to enable and set up the best binary options indicators on Futura Broker. RSI, Supertrend and Bollinger Bands in practice.
You've already placed your first trade and noticed that staring at a chart with no reference points is like driving without a dashboard — you can go, but you have no idea how fast. Technical indicators are exactly that: your chart's dashboard. They don't predict the future and they don't guarantee a win. But they show you what's happening to the price right now — and that alone completely changes the way you trade.
By the end of this guide, you'll know which 2 indicators to enable and how to read each one in practice.
What technical indicators are
Technical indicators are mathematical calculations applied to an asset's price and volume. They turn raw data into visual information that helps you spot trends, momentum and volatility.
Think of a car's dashboard: the speedometer shows the speed (momentum), the compass shows the direction (trend) and the gauge shows the engine temperature (volatility). Each instrument measures something different — and together, they give you a complete read on the situation.
Indicators don't predict the future — they show you what's happening right now. And that's already a lot.
The platform has 12 indicators organized into categories: Momentum, Trend, Volatility, Moving Averages and Volume. You don't need to know them all — but you do need to master at least 2.
How to enable an indicator on the platform
The process is quick and works the same way for any of the 12 indicators:
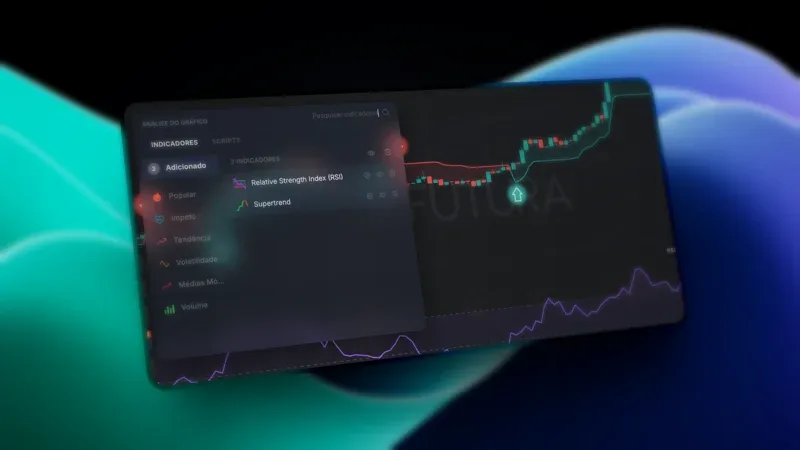
1. Open the indicators panel — Click the pulse icon in the chart toolbar. If you already have active indicators, the icon shows the count next to it.
2. Browse the categories — On the left side you'll find: Popular, Momentum, Trend, Volatility, Moving Averages and Volume. Or use the search bar at the top to find one by name.
3. Click the indicator — It's activated on the chart and the settings screen opens automatically.
4. Adjust the parameters — In the "Parameters" tab: period, levels, data source (close, open, high, low). In the "Style" tab: color, thickness (1-4px) and line style (solid, dashed, dotted).
5. Apply — Click "Apply". The indicator appears on the chart in real time.
Tip: to remove an indicator, open the panel, go to "Added" and click the trash icon. To hide it temporarily without removing it, use the eye icon. And if you want quick access to your favorites, click the star icon — they'll show up first next time.
The 3 essential indicators to get started
Each one measures something different. Together, they cover the three dimensions of technical analysis: momentum, trend and volatility.
RSI (Relative Strength Index)
What it measures: the strength of the recent move — whether the price has gone up "too much" or down "too much" relative to the period analyzed.
How to read it: the RSI is a scale from 0 to 100.
- Above 70 = overbought (the price may pull back)
- Below 30 = oversold (the price may rise)
- Between 30 and 70 = neutral zone
Default setting: period 14. It's the most widely used in the market — don't change it until you fully understand what the number means.
Where it appears: in a separate panel, below the candlestick chart.
Practical example: if the RSI for BTCUSDT is at 78, the asset is overbought. It doesn't mean it will drop right now — but the odds of a correction increase. It's a signal to watch, not to act on impulse.
Supertrend
What it measures: the direction of the current trend — up or down.
How to read it: a colored line over the chart's candles.
- Green line below the candles = uptrend
- Red line above the candles = downtrend
- Color change = the market may be reversing
Default setting: period 10, multiplier 3.
Where it appears: right on the chart, over the candles — visually it's the clearest indicator on the platform.
Practical example: if the line is green and the price keeps holding above it, the uptrend is active. If it turns red, pay attention — it may be time to consider a SELL trade.
Why it's ideal for beginners: green goes up, red goes down. No mental math, no numerical scales. It's the most visual indicator we have.
Bollinger Bands
What it measures: volatility — whether the price is moving a lot or a little.
How to read it: three lines form a "channel" around the candles — upper band, central average and lower band.
- Price touching the upper band = it may be stretched too far up
- Price touching the lower band = it may be stretched too far down
- Bands tightening = a strong move is coming (it doesn't tell you the direction, but it tells you it's about to move)
Default setting: period 20, standard deviation 2.
Where it appears: right on the chart, wrapping the candles like a dynamic channel.
Practical example: when the bands tighten and get very narrow, the market is "getting ready" for a strong move. It doesn't tell you whether it will go up or down — but it tells you the calm is about to end.
All available indicators
The platform offers 12 indicators. Here's a quick reference for each one:
| Indicator | Category | What it measures | Best for |
|---|---|---|---|
| RSI | Momentum | Overbought/oversold | Spotting price extremes |
| Stochastic | Momentum | Overbought/oversold | Crossover signals |
| MACD | Momentum | Trend + momentum | Trend confirmation |
| Momentum | Momentum | Price speed | Strength of the move |
| Moving Average (SMA) | Trend | Price direction | Long-term trend |
| EMA | Trend | Price direction (reacts fast) | Short-term trend |
| Supertrend | Trend | Direction and reversal | Clear visual signals |
| Bollinger Bands | Volatility | Price range | Breakout moments |
| ATR | Volatility | Intensity of the move | Measuring volatility |
| Volume | Volume | Market activity | Confirming breakouts |
| Parabolic SAR | Trend | Direction and reversal | Reversal points |
| Candlestick Patterns | Patterns | Candle formations | Spotting patterns |
You don't need to learn them all now. Start with the 3 we explained above and explore the others once you feel comfortable. To understand the basics of candlestick patterns before enabling the indicator, read how to read a candlestick chart.
The golden rule: 2 indicators at most
The temptation to enable them all is strong. Resist it.
The redundancy problem: RSI and Stochastic measure the same thing — momentum. Using both is like having two speedometers on the dashboard. When they agree, one would have been enough. When they disagree, you freeze and don't know which one to trust.
The rule is simple: pick 1 trend indicator + 1 momentum indicator. The combination we recommend for beginners: RSI + Supertrend.
This is Mistake #4 on our list of 5 mistakes every beginner trader makes — worth the full read. The short version: filling your chart with indicators creates the illusion of a more complete analysis, but in practice it generates confusion and paralysis.
Too many indicators don't improve your analysis — they get in the way. What improves it is context. Support and resistance shows you WHERE your indicators are most reliable — and where they're traps.
Practical tips
- Use the Practice Account to test indicators risk-free — that's exactly what it's for
- Start with RSI + Supertrend and trade with them for at least 2 weeks before switching
- Don't change the default parameters until you understand what each number does — the defaults are the most widely used for a reason
- Watch the indicator for a few candles before trading — don't react to the first signal
- Use the star icon to favorite the indicators you use most — they'll show up first next time
- Take notes on when the indicator got it right and when it got it wrong. After 50 trades, you'll have real data on what works for your style
Next step
Indicators are reading tools, not crystal balls. Start with 2, truly learn how they behave and evolve your decisions with data — not with guesswork.
If you haven't placed your first trade yet, start with our guide on how to place your first trade. And if you want to understand the market better before going deeper, read about what binary options are and how they work.
Head to futurabroker.com, enable RSI and Supertrend on the chart and start reading the market — on the practice account, risk-free.