Candlestick Patterns: A Practical Guide
Learn the most useful candlestick patterns for trading binary options. Hammer, Engulfing, Shooting Star and more — a practical guide.
You open the platform and see green and red bars going up and down. What are they? What do they mean? Why are some big and others small? Why do some have "threads" coming out of the top and bottom?
These bars are called candlesticks. They are the most widely used way to visualize price in the entire world. Every article on this blog, every strategy, every concept assumes you know how to read them. The article on support and resistance talks about a "rejection candle" and a "long wick." The 3 strategies for beginners say "open a trade on the next candle." The indicators tutorial lists "Candlestick Patterns" as an indicator. All of this assumes you know what a candlestick is.
After reading this article, you will look at the chart and understand — in real time — who is winning: buyers or sellers. That is the most valuable piece of information in all of trading.
If you just arrived and want to understand the market from scratch, first read what are binary options. If you already know the basics and want to read the chart, you are in the right place.
What a candlestick chart is
Each "candle" on the chart represents a period of time. On a 5-minute chart, each candle shows what happened to the price over 5 minutes. On a 1-minute chart, each candle shows 1 minute of price action.
Each candle contains 4 pieces of information: where the price started (open), where it ended (close), the highest point it reached (high) and the lowest point (low). Four data points in a single visual bar — no other type of chart shows so much information at once.
It is the platform's default chart type — it is already active when you open the app. There is nothing to configure. Other types exist (Line, Area, Bars), but the candlestick chart shows MORE information at once. That is why it is the favorite of traders worldwide.
If the line chart tells you the final score of the game, the candlestick chart shows you the plays.
Recommended timeframe for beginners: 5 minutes. It balances signal frequency with reliability. You switch the timeframe in the selector above the chart.
Anatomy of a candle
The most important section of this article. After reading it, you will break down any candle in seconds.
Body
The thick, rectangular part of the candle. It runs from the open price to the close price.
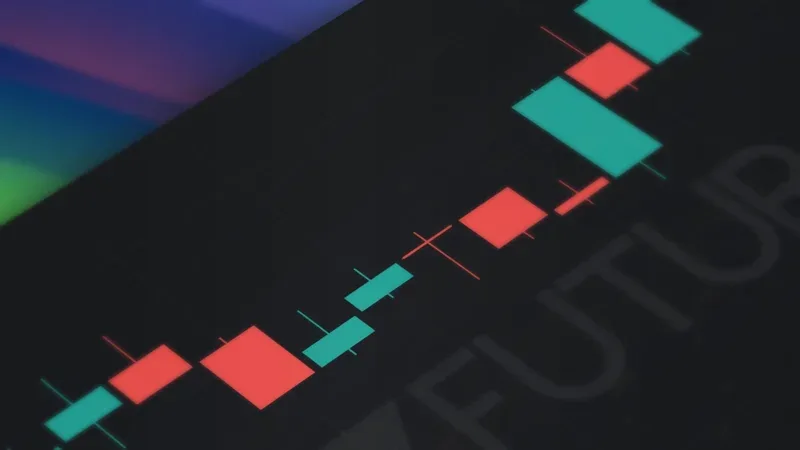
- If the price rose → green body (open at the bottom, close at the top)
- If the price fell → red body (open at the top, close at the bottom)
- Large body = strong move, conviction. One side dominated
- Small body = little movement, indecision. No one dominated
Upper wick (upper shadow)
The thin line coming out of the top of the body. It shows the highest point the price reached during the period.
Long upper wick = the price tried to rise, but was pushed back down. Sellers defended.
Lower wick (lower shadow)
The thin line coming out of the base of the body. It shows the lowest point the price reached during the period.
Long lower wick = the price tried to fall, but was pushed back up. Buyers defended.
The universal logic:
- Body = who won the period (buyers or sellers)
- Wick = who tried and FAILED
- Green color = buyers won. Red color = sellers won
There is nothing to memorize. The body is the result. The wick is a failed attempt. The color is the winning side.
What the shape of a candle reveals
Now that you know the anatomy, here is what the most common shapes mean:
Large body, short wicks — Decisive move. One side dominated without contest. Green = buyers in total control. Red = sellers in total control.
Small body, long wicks — Intense battle. The price went up and down but ended almost where it started. Indecision — the market is hesitating.
Body at the top, long lower wick — The price fell a lot but buyers pushed it back up. A sign of buying strength (called a "Hammer" at support).
Body at the base, long upper wick — The price rose a lot but sellers pushed it back down. A sign of selling strength (called a "Shooting Star" at resistance).
Almost no body, wicks on both sides — A draw. No one won. Called a "Doji." When it appears, WAIT — do not trade until the next candle confirms the direction.
The key: do not memorize names. Understand the LOGIC — large body = conviction, long wick = rejection, small body = indecision. With this logic, you can read any candle.
5 essential patterns for binary options
The most useful patterns for making decisions. Focused on visual recognition and practical application.
1. Hammer
- Visual: small body at the top, long lower wick (2x or more the size of the body)
- Meaning: buyers defended forcefully
- When to trade: appears in a SUPPORT zone → BUY
- It is the "rejection candle" we described in the article on support and resistance
2. Shooting Star
- Visual: small body at the base, long upper wick (2x or more the size of the body)
- Meaning: sellers defended forcefully
- When to trade: appears in a RESISTANCE zone → SELL
3. Bullish Engulfing
- Visual: a green candle that COMPLETELY covers the body of the previous red candle
- Meaning: buyers took control abruptly
- When to trade: after a sequence of decline → BUY
4. Bearish Engulfing
- Visual: a red candle that COMPLETELY covers the body of the previous green candle
- Meaning: sellers took control abruptly
- When to trade: after a sequence of advance → SELL
5. Doji
- Visual: tiny body (almost a line), wicks in both directions
- Meaning: a total draw. The market is undecided
- When to trade: DO NOT trade on the Doji. Wait for the next candle to confirm which way the market has decided to go
| Pattern | Appearance | Signal | Where it is strong |
|---|---|---|---|
| Hammer | Body at the top, long lower wick | Up | At support |
| Shooting Star | Body at the base, long upper wick | Down | At resistance |
| Bullish Engulfing | Green engulfs previous red | Up | After a decline |
| Bearish Engulfing | Red engulfs previous green | Down | After an advance |
| Doji | Tiny body, equal wicks | Indecision | DO NOT trade alone |
The platform detects these 5 patterns — plus 8 more — automatically with the Candlestick Patterns indicator. See how to enable it in how to use indicators on the chart.
Reading the sequence, not just the candle
A single candle tells what happened in 5 minutes. But what matters for your trade is the CONTEXT — what happened BEFORE that candle.
- 3 consecutive green candles with a growing body = uptrend ACCELERATING. Buyers are getting more and more aggressive
- A large green candle followed by a Doji = the momentum may be running out. Beware of a reversal
- A large red candle followed by a Hammer at support = sellers tried but buyers held. A strong buy signal
The rule: a single candle tells you who won. The sequence tells you who is WINNING.
Never make a decision based on an isolated candle. Look at at least the previous 3-5 candles. The pattern becomes clear in the sequence, not in a single point.
This is the foundation of what we call price action — reading what the price is doing directly, without any indicator. The 3 strategies for beginners use indicators to make this reading easier, but now you know how to read the chart on your own. And watch out for Mistake #3 — overtrading. Knowing how to read candles does not mean trading every interesting candle.
The platform's Candlestick Patterns indicator
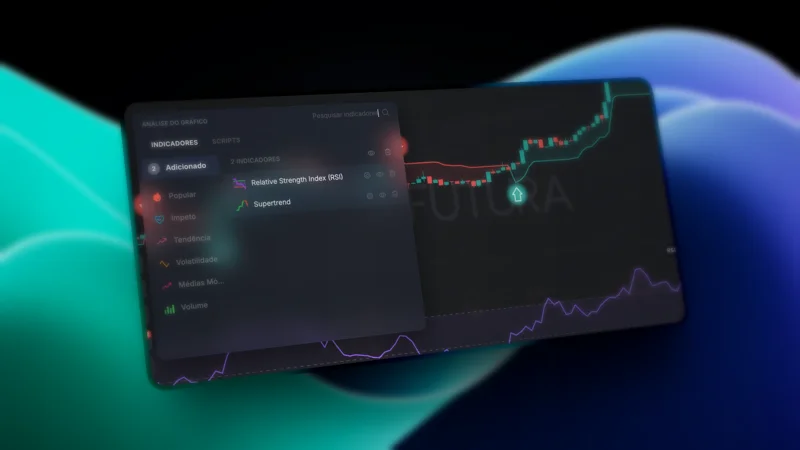
Futura Broker has an automatic indicator that identifies 13 candlestick patterns in real time. How to enable it: click the indicators icon, search for "Candlestick Patterns" and turn it on.
What it shows — colored arrows on the chart when a pattern is detected:
- Green arrow ↑ below the candle = bullish pattern (Hammer, Engulfing, Morning Star, Piercing, 3 Soldiers)
- Red arrow ↓ above the candle = bearish pattern (Shooting Star, Engulfing, Evening Star, Dark Cloud Cover, 3 Crows)
- Yellow diamond = neutral pattern (Doji)
You can configure which patterns to display and customize the colors and size of the markers.
Important: use the indicator as an ASSISTANT, not as a replacement for your own reading. The indicator shows WHAT appeared — you decide WHETHER it is worth trading based on the context (where on the chart, the preceding sequence, proximity to S&R).
The complete step-by-step guide to enabling indicators is in the tutorial on how to use indicators on the chart.
Timeframes: how time changes the candles
The same price move produces different candles depending on the timeframe.
1 minute: each candle = 1 minute. A lot of noise, many false signals. Small candles, erratic movements. Hard to read for beginners.
5 minutes: each candle = 5 minutes. The sweet spot. Cleaner signals, candles with more meaning. Recommended for beginners.
15 minutes: each candle = 15 minutes. Stronger signals, less frequent. Good for those who prefer fewer trades with higher quality.
On the platform, switch the timeframe in the selector above the chart. Try viewing the same asset on 1m and 5m — the difference in clarity is immediate.
For binary options with a 5-minute expiry, use a 5-minute chart. The expiry should match the timeframe — it is the rule that applies to any strategy.
Practicing your reading
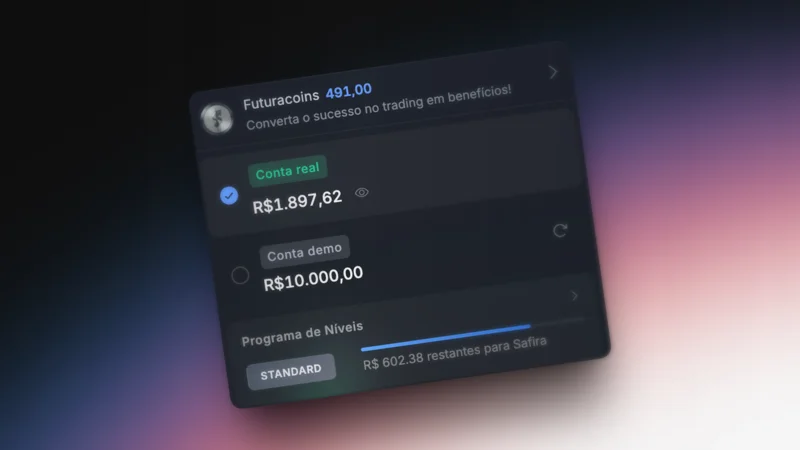
- Open the practice account, choose BTCUSDT (or BTCUSDT-OTC, available at any time — learn more in OTC on Futura Broker), 5-minute chart
- Watch 10 candles without trading. For each one, say out loud: "large green body, small lower wick = buyers dominated"
- Enable the Candlestick Patterns indicator and compare it with your reading
- Identify 3 candles with long wicks — what happened in the following candles?
- After 30 minutes of observation, make your first trade based on reading candles
If you are deciding between a practice account and a real account, read our guide on demo account vs. real account.
The 7 rules of reading candles
- Body = who won. Green = buyers. Red = sellers.
- Wick = who tried and failed. Long wick = strong rejection.
- Large body = conviction. Small body = indecision.
- Doji = the market is hesitating. Wait for confirmation, do not trade.
- Never read a candle in isolation — observe the sequence and the context.
- Candles in support/resistance zones are more significant than candles somewhere in the middle.
- Use the Candlestick Patterns indicator as an assistant, not as a replacement for your own reading.
Each candle tells a 5-minute story between buyers and sellers. Learning to read these stories is the most fundamental skill in trading — everything that comes after rests on it. The more charts you read, the faster the patterns will jump out at you.
Now that you know how to read candles, the next step is to learn WHERE they matter most — read our guide on support and resistance in practice. And never trade without bankroll management.
Visit futurabroker.com, open the chart and start reading your first candles — on the practice account, risk-free.