Support and Resistance in Practice
Learn to spot support and resistance zones on the chart and use these levels to filter signals, avoid traps, and trade with more precision.
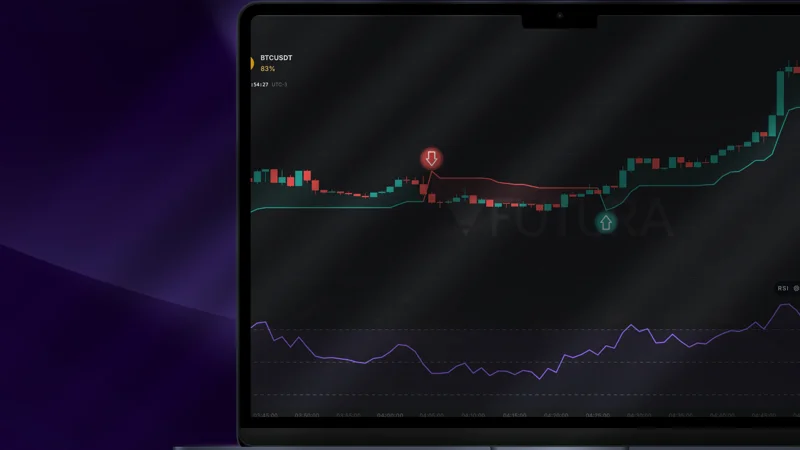
Your indicator says BUY. But price is pushing against a ceiling where it was already rejected 3 times this morning. You enter and you lose. Sound familiar?
Indicators tell you WHAT is happening with price — whether momentum is rising, whether the trend has flipped, whether volatility has expanded. But they don't tell you WHERE price tends to react. Support and resistance fill that gap. They are the levels on the chart where price has historically stopped, reversed, or accelerated. Without that context, you're following blind signals.
After reading this article, you'll look at the chart and see levels that change your decision BEFORE any indicator gives a signal. Support and resistance don't replace indicators — they're the context that makes indicators 10x more useful.
The 3 strategies for beginners we've already covered on the blog teach you when to enter. This article teaches you why WHERE you enter makes a difference.
What support and resistance are
Support is the zone where price tends to stop falling and turn back up. It works like a floor — price rests on it. Resistance is the zone where price tends to stop rising and turn back down. It works like a ceiling — price hits it and bounces back.
Why does it work? It's not magic — it's collective behavior. Many traders watch the same prices and place orders at those levels. When price reaches that zone, the accumulated orders create pressure in the opposite direction. It's supply and demand concentrated at a single point on the chart.
A critical point: think in zones, not lines. Price doesn't stop at exactly the same point every time — it reacts within an AREA. "Support at 65,000" actually means "the zone between 64,900 and 65,100 where price tends to react." This shift in mindset prevents frustration — if you expect price to touch an exact line, you'll miss most of the signals.
If BTCUSDT dropped to the 65,000 region three times this morning and bounced back up each time, that zone around 65,000 is support. It's that simple.
How to identify it on the chart
Marking support and resistance is a visual skill. There's no formula — there's observation. Follow these steps:
Step 1: Set the chart to 5 minutes — the default timeframe for beginners. Not too fast (1 minute generates noise), not too slow (1 hour hides details of the current session).
Step 2: Zoom out a little to see 1-2 hours of history. You need context, not just the last few candles.
Step 3: Look for areas where price changed direction at least 2 times. The more times price reversed in the same zone, the stronger the level.
Step 4: Mark the zone with a horizontal line. On Futura Broker, click the drawing tool in the chart toolbar and select "Horizontal Line." Place it in the center of the zone. To mark a wider zone, use the "Rectangle" — it makes the area visually clear.
Step 5: Focus on the 2-3 levels closest to the current price. Distant levels are irrelevant for the next trade.
| Signal | Strength |
|---|---|
| Price reversed 2x in the same zone | Moderate |
| Price reversed 3x+ | Strong |
| Round number (x.000, x.500) | Psychological |
| Old support acting as resistance (or vice versa) | Very strong |
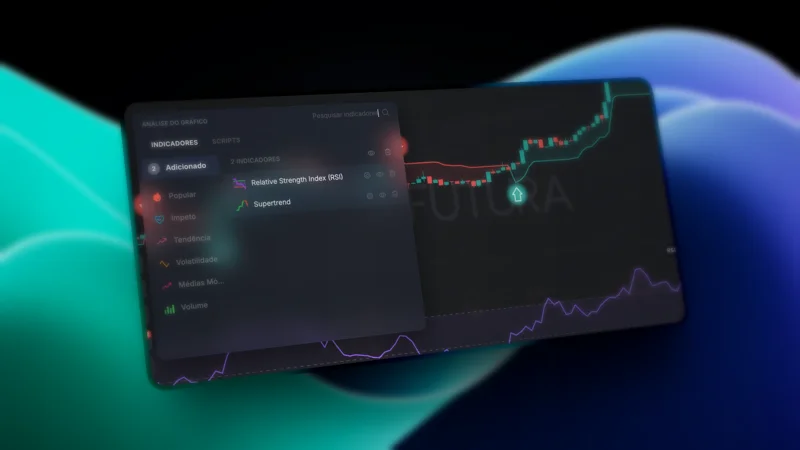
If you haven't explored the chart tools yet, read the tutorial on how to use indicators on the chart — there you'll learn to navigate the tools panel.
The most common mistake: drawing too many levels
If every bounce is a "level," none of them is a level. It's the same problem as filling the chart with indicators — more information doesn't mean better analysis. The more lines on the chart, the harder it gets to make a decision.
Rule of thumb: if you can't see the level within 5 seconds of looking at the chart, it isn't significant enough. Real levels jump out at you — you don't need a magnifying glass to find them.
Mark a maximum of 3 levels at a time. Two is better. And levels have an expiration date: yesterday's may not hold today. Clean up and redraw each session. Opening the platform with 15 lines from last week is starting the day confused.
This is the same principle as Mistake #4 (too many indicators) — less is more when it comes to reading the chart.
Role reversal: when support becomes resistance
This is the most important concept in the article. It separates the beginner from the intermediate trader.
When price breaks a support to the downside, that zone becomes resistance on the way back up. When price breaks a resistance to the upside, that zone becomes support on the way back down.
Why? Trapped traders. Whoever bought at the support is losing money after the break. When price returns to that zone, they sell to "break even" — that selling pressure creates resistance exactly where support used to be. It's predictable human behavior: the pain of a loss makes the trader wait for the chance to get out without a loss.
Example: BTCUSDT had support at 65,000 — price hit it 3 times and bounced. On the fourth time, it broke down to 63,000. Now when price rises back toward 65,000, the traders who bought there want to break even. Result: selling pressure at 65,000 = resistance.
This is the most reliable pattern in technical analysis because it's based on human behavior, not on calculations. In practice: when a level breaks, DON'T delete the line. Change its color. It will serve as a reference in the opposite direction.
How to trade support and resistance in binary options
Two clear strategies and one golden rule.
Strategy 1 — Bounce trade:
Price approaches a support zone → wait for a rejection candle (long lower wick, body closing ABOVE the zone) → BUY on the next candle. Price approaches a resistance zone → wait for a rejection candle (long upper wick, body closing BELOW the zone) → SELL on the next candle. Expiration: 5 minutes on a 5-minute chart.
The key is waiting for the REJECTION. Don't enter just because price touched the zone. The rejection candle — with its long wick — is the confirmation that the zone is holding. If terms like wick, body, and rejection candle are new to you, first read our guide on how to read a candlestick chart.
Strategy 2 — Breakout trade:
Price breaks resistance with a full, strong-bodied candle → BUY on the next candle. Price breaks support with a full, strong-bodied candle → SELL on the next candle. Expiration: 5-10 minutes — breakouts can take some time to develop.
The key: the candle has to CLOSE beyond the zone. A wick that pokes through and pulls back is not a breakout — it's a trap. Wait for the close.
| Scenario | Strategy | Direction |
|---|---|---|
| Price at support, rejection candle | Bounce | BUY |
| Price at resistance, rejection candle | Bounce | SELL |
| Strong candle closed above resistance | Breakout | BUY |
| Strong candle closed below support | Breakout | SELL |
| Price between two levels, no clear direction | DON'T TRADE | — |
The golden rule for binary options: you only need price to be 0.01% in your direction at the moment of expiration. A touch at support with a small rejection is already enough. You don't need a big move — you need the right DIRECTION. That's what makes support and resistance the perfect tool for binary options.
Don't trade when price is in the MIDDLE between two levels. Wait for it to reach a zone. One good trade at a confirmed level is worth more than five trades in no man's land.
If this is your first trade, first read the tutorial on how to place your first trade.
S&R as a filter for your strategies
This is where everything connects. Support and resistance aren't a standalone strategy — they're a filter that supercharges ANY strategy you already use.
Parabolic SAR + S&R:
- SAR flips to buy NEAR a support = strong signal, enter
- SAR flips to buy NEAR a resistance = weak signal, skip it
- The strategies article says "when the SAR flips, enter." S&R say: "WHERE it flips matters."
Supertrend + RSI + S&R:
- RSI exits oversold (below 30) AND price is at a support = very high-probability trade
- RSI exits overbought (above 70) AND price is at a resistance = very high-probability trade
- Three independent confirmations pointing the same direction
Bollinger Bands + Stochastic + S&R:
- Price touches the lower Bollinger band AT a support = bounce with maximum probability
- Indicator + volatility + price structure, all aligned
The rule is simple: an indicator aligned with support and resistance is a signal. An indicator against support and resistance is a trap.
Reread the 3 strategies for beginners with this filter in mind — you'll see every setup differently. And regardless of the setup, respect your bankroll management. S&R improve the probability, but no setup is 100%.
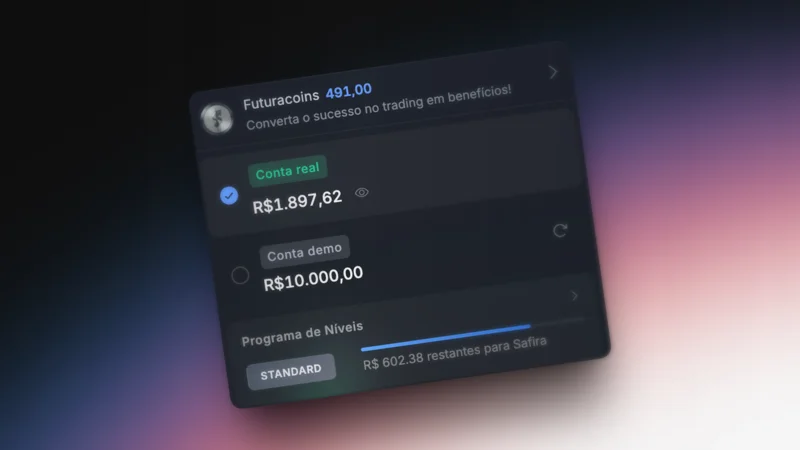
Practicing on the practice account
The best training is observing before trading. Follow this routine:
- Open the practice account, pick BTCUSDT, set the chart to 5 minutes
- Mark 2-3 support and resistance zones using the Horizontal Line tool
- Watch price behavior at those levels for 15 minutes WITHOUT trading. Just watch
- When price reaches a zone and shows rejection, make your first S&R trade
- Log it in your journal: which zone, which confirmation, which result
- After 20 trades at S&R zones, compare the win rate of those trades with your overall win rate. The difference will surprise you
If you're deciding between demo and real, first read our guide on demo account vs. real account.
The 7 rules of support and resistance
- Identify 2-3 strong levels before trading — never enter without looking at the map.
- Mark zones, not exact lines — price reacts in areas, not at points.
- Less is more: if you have to force yourself to see it, it isn't a level.
- Watch for role reversal — broken support becomes resistance.
- Don't trade in the middle of two levels — wait for price to reach a zone.
- When the indicator goes against a strong level, trust the level.
- Clean your levels each session — old levels lose relevance.
Indicators tell you what is happening. Support and resistance tell you where it will happen again. It's an observation skill that improves with practice — the more charts you read, the faster the levels will jump out at you.
If you're just starting out, first understand what binary options are. If you already trade with indicators, go back to the chart with fresh eyes — the levels are there, waiting to be noticed.
Go to futurabroker.com and mark your first levels on the practice account.