
NeuroScript Editor: Your First Indicator From Scratch, Step by Step
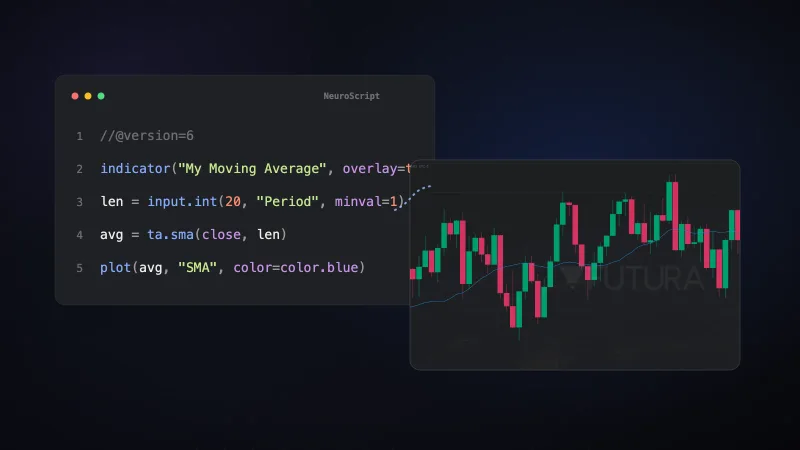
Illustrated guide to the Futura Broker NeuroScript editor: write, run and configure your first indicator with 5 lines of code. No coding experience needed.
If you already know how to use indicators on the chart, you've probably run into this: the RSI is fine, the Supertrend is fine, but you wanted that line to behave a specific way. A period nobody uses, a combination no ready-made indicator gives you. And then you stall, because building your own indicator sounds like something for programmers.
Spoiler: it takes 5 lines. What's usually missing is someone showing you how the editor actually works, and that's what this tutorial does.
You'll write your first indicator in the Trade Room's NeuroScript editor, understand every line, run it on a real chart, then adjust the parameters through the interface without going back to the code. Screenshots all the way through.
And if you'd rather have the AI write the code for you, that path exists too — the AI creation tutorial covers it. This guide is for anyone who wants to understand what they're writing. In practice you'll end up using both: knowing the code makes you much better at refining whatever the AI produces.
What is NeuroScript
NeuroScript is Futura Broker's native indicator language. You use it to describe calculations (averages, oscillators, bands) and drawings (lines, levels, fills), and the platform runs all of that over the real candles of whatever asset you're trading.
One analogy that holds up: it's a recipe. The ingredients are the prices (open, close, high, low), the method is the calculation, and the cake is the line on your chart. NeuroScript is where you write the recipe down.
You don't need to know how to code to follow along. The 5 lines we're about to write explain themselves, and they're the skeleton of pretty much any indicator you'll build later.
Step 1: Open the SCRIPTS tab
The editor lives inside the indicators panel:
1. Open the indicators panel — the pulse icon in the chart toolbar.
2. Go to the SCRIPTS tab — the panel has two tabs at the top, INDICATORS and SCRIPTS. Your NeuroScript scripts live in the second one.
3. Click "Open Script Editor".
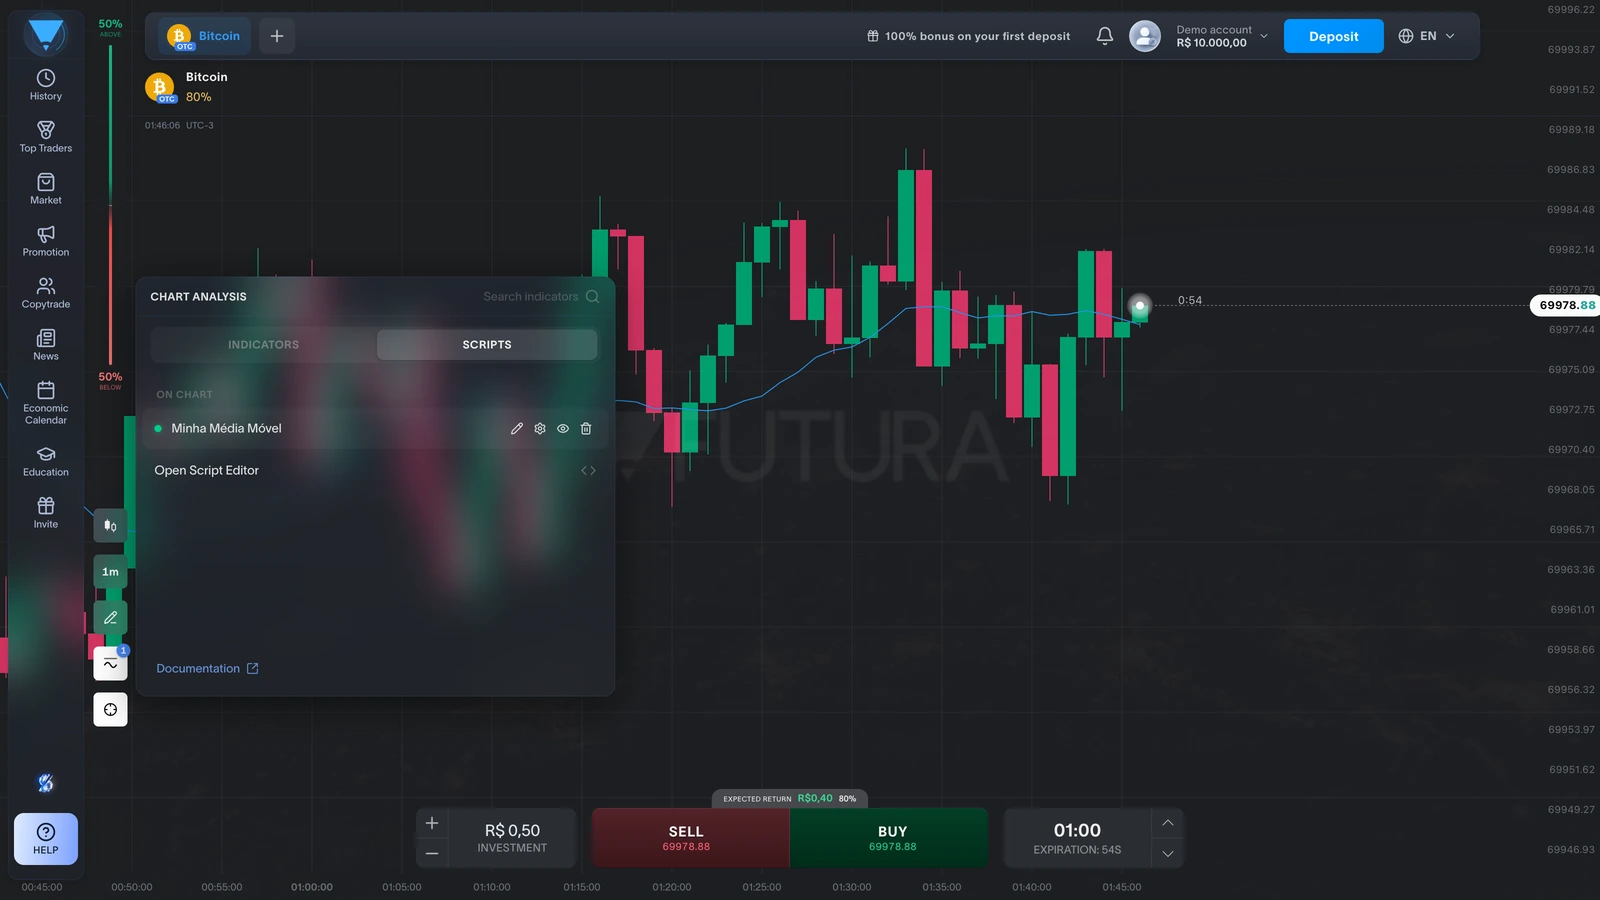
Two things on this screen worth noting: the ON CHART section shows which script is currently active (with a green dot when it's drawn), and the Documentation link in the footer opens the full language reference, every function with examples.
Tip: your Marketplace Scripts show up on this tab too. If you bought a script or received one by invite, it's listed there with a "Use" button — no code involved in that case.
Step 2: Get to know the editor
The Neuro Script® Editor opens full-screen. Four areas:
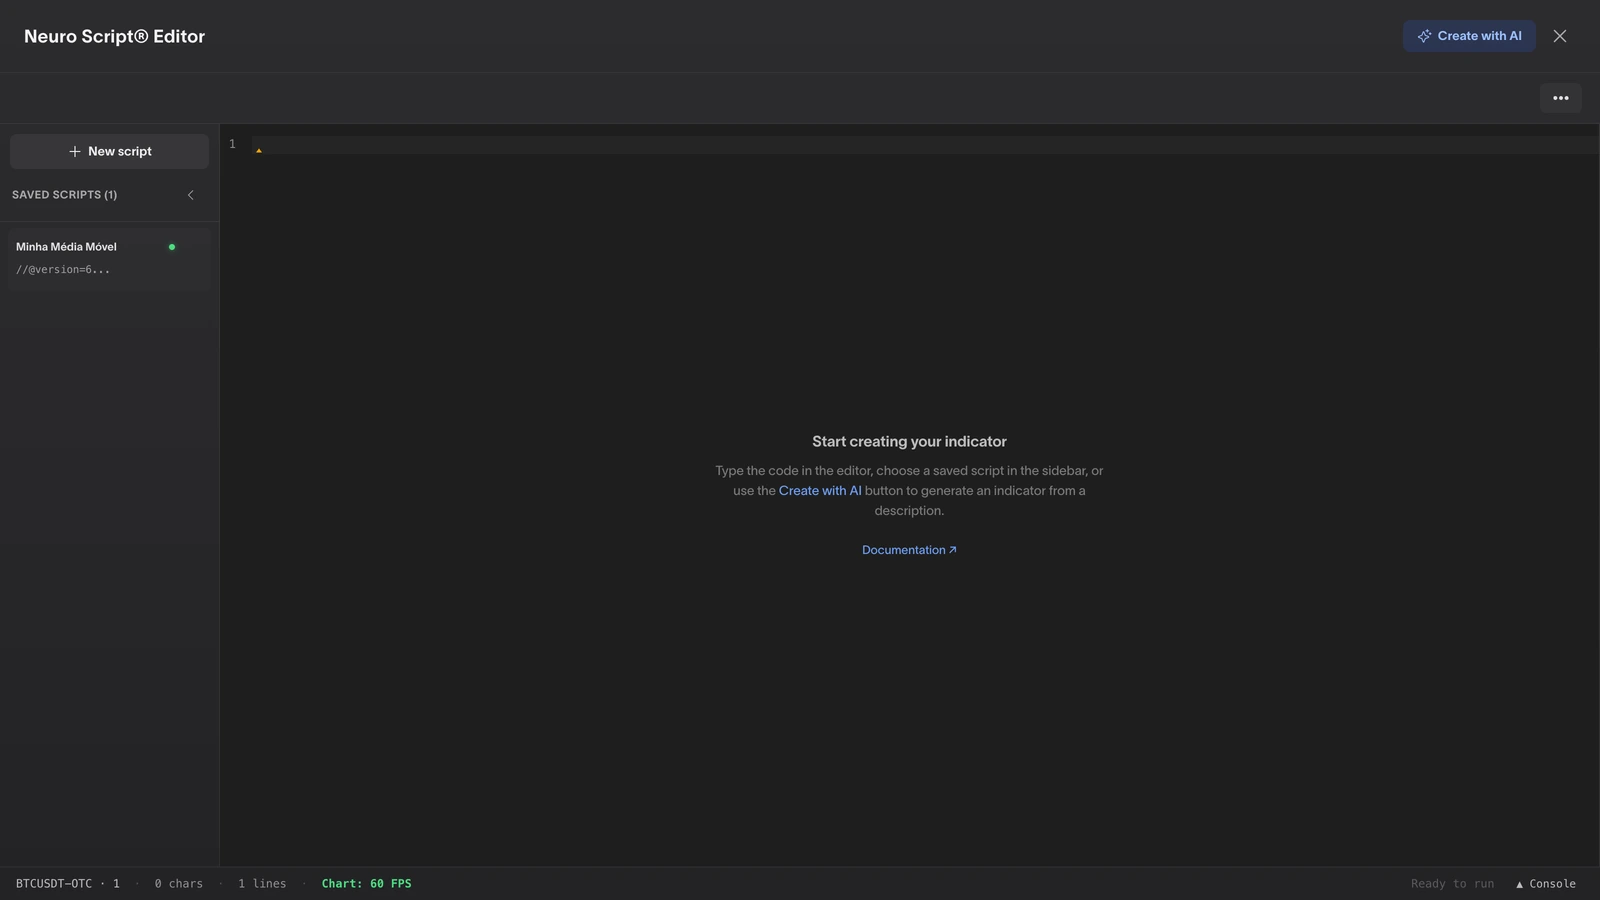
- Toolbar (top) — the Add to Chart and Save buttons, plus the "⋮" menu with import, export and publish.
- Sidebar (left) — the New script button and the Saved Scripts list. Click a script and its code loads into the editor.
- Code area (center) — where you write. There's autocomplete: type
ta.and the editor lists the technical analysis functions available. - Status bar (bottom) — asset, timeframe, line count, and an unsaved-changes warning when you have pending edits.
Technical note: the editor keeps an automatic draft while you type. Closed the tab by accident, hit F5 — your code comes back the next time you open it. Saving with Cmd/Ctrl+S every so often is still a good habit, though.
Step 3: The 5 lines of your first indicator
We're building a simple moving average, the bread and butter of technical analysis. Type (or paste) this into the editor:
//@version=6
indicator("Minha Média Móvel", overlay=true)
len = input.int(20, "Período", minval=1)
media = ta.sma(close, len)
plot(media, "SMA", color=color.blue)
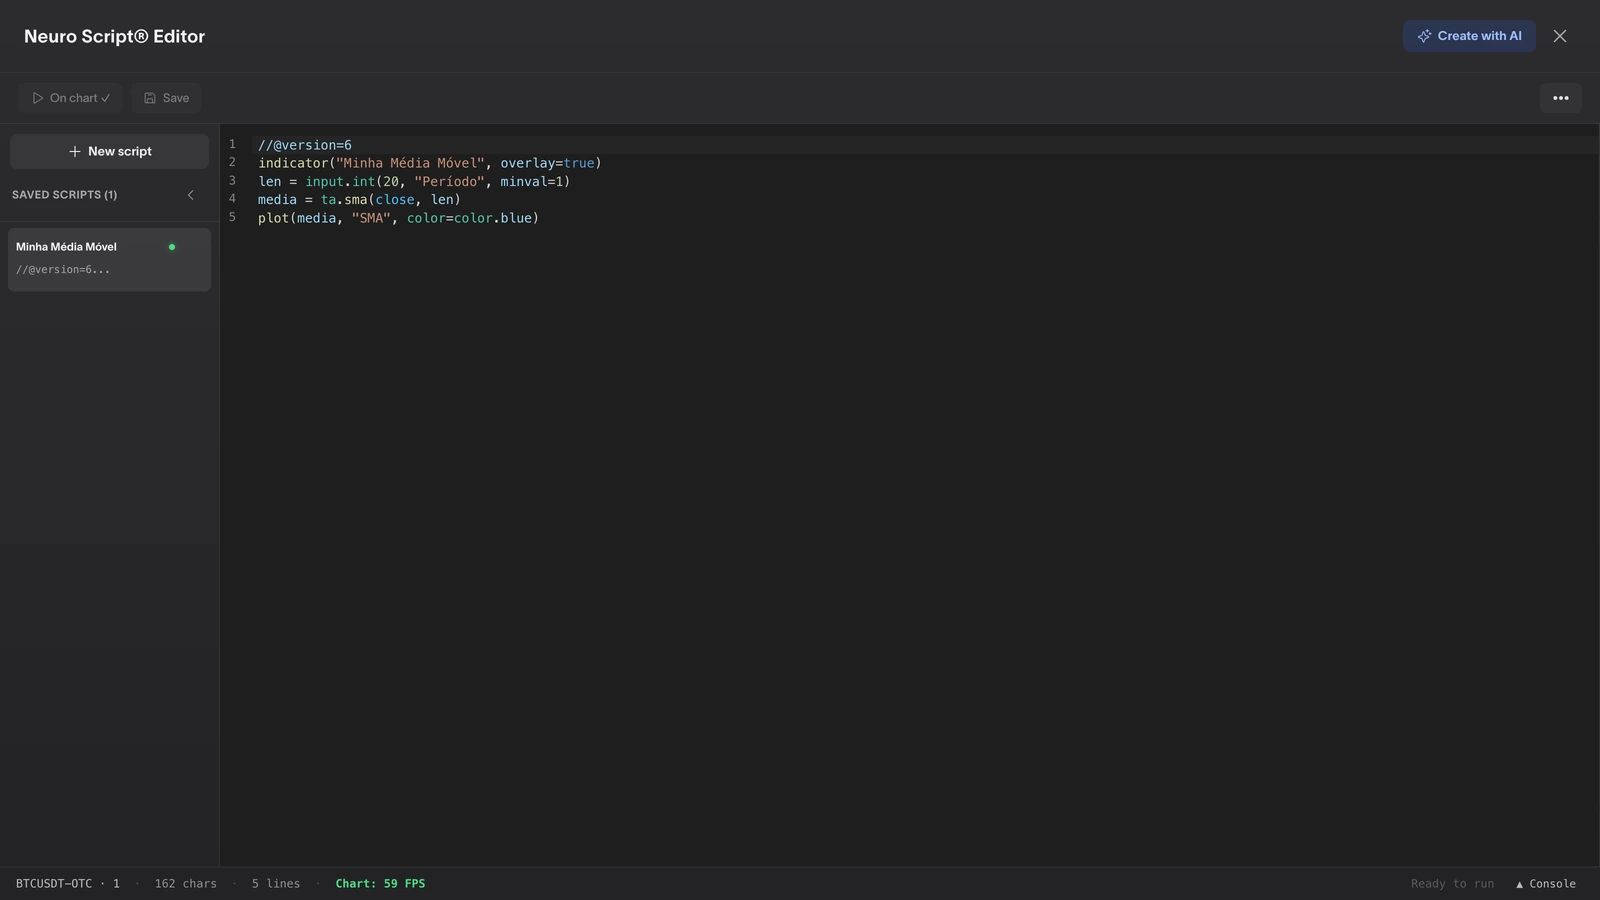
Now, what each line actually does, because copying without understanding doesn't get you far:
indicator("Minha Média Móvel", overlay=true)— the script's identity. The name in quotes is how it appears in the panel.overlay=truetells it to draw on top of the candles; leave it out and the indicator gets its own pane below the chart, like the RSI does.len = input.int(20, "Período", minval=1)— the configurable parameter. It creates an integer that starts at 20, shows up under the label "Período" and won't accept anything below 1. This is the line that gives your indicator a settings screen later — we'll come back to it in Step 5.media = ta.sma(close, len)— the calculation.ta.smais the simple moving average,closeis the closing prices,lenis the period from the line above. The result is the average of the last 20 closes, recalculated on every candle.plot(media, "SMA", color=color.blue)— the drawing. It takes the calculated value and turns it into a blue line on the chart. Withoutplot, the calculation happens but nobody sees anything.
What about the first line (//@version=6)? That's just the language version header. Every script starts with it.
Tip: swap ta.sma for ta.ema and you've got an exponential moving average. Swap it for ta.rsi (and drop the overlay=true) and you've got an RSI. The 5-line structure stays the same; only the calculation changes.
Step 4: Run it on the chart
Click Add to Chart (or Cmd/Ctrl+Enter). The editor compiles the code, runs it over the current asset's candle history and draws the line:
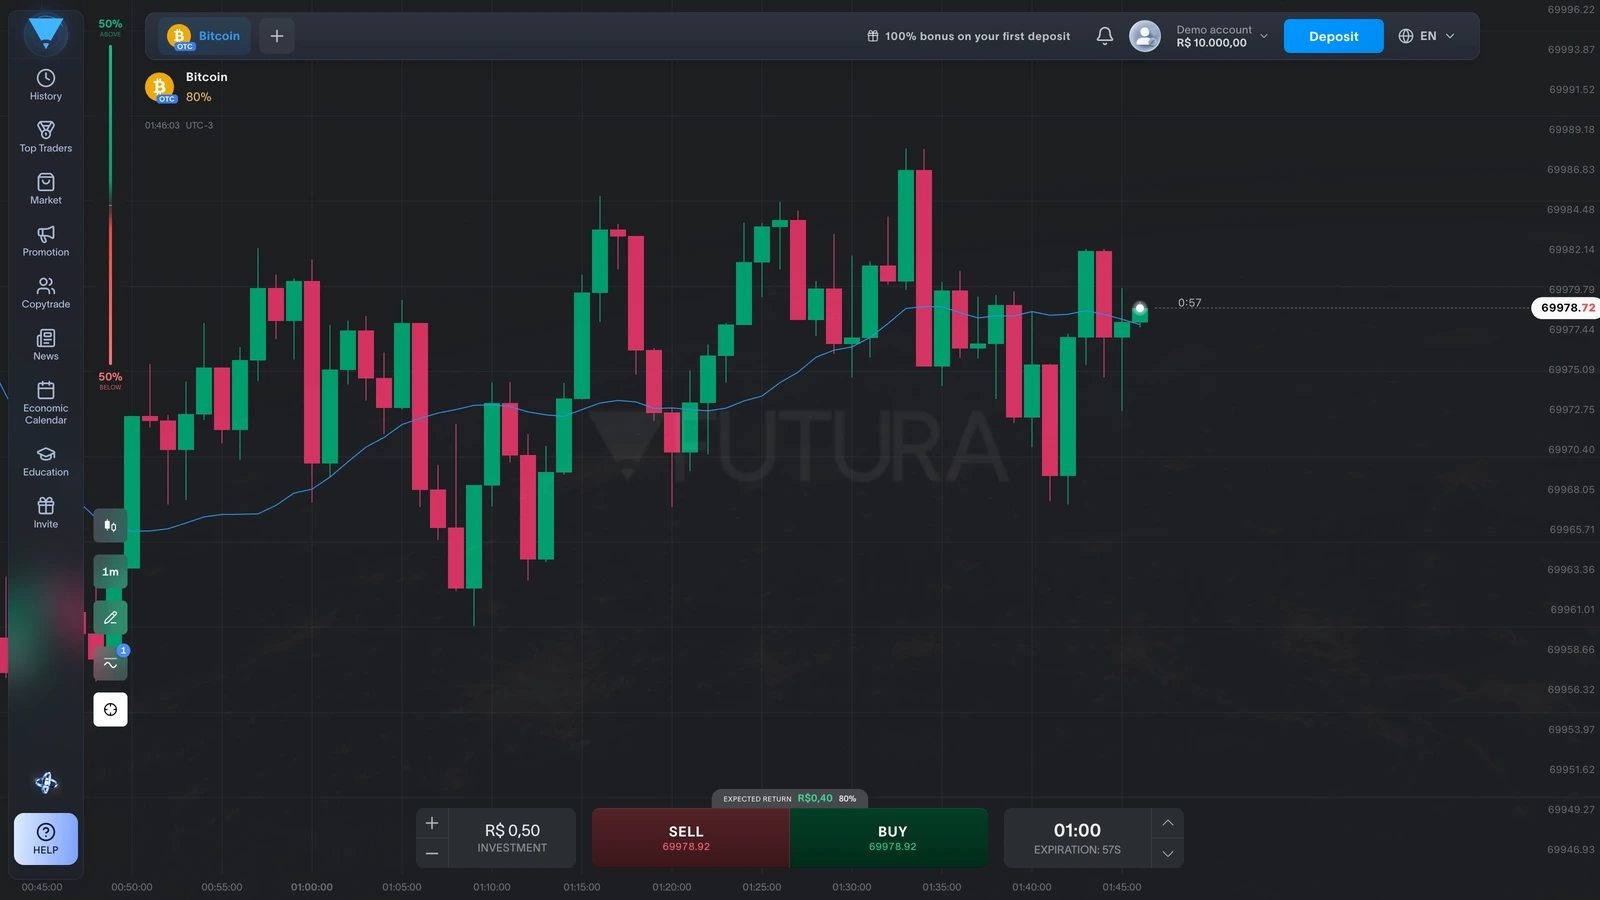
Three behaviors you'll run into:
- Got an error? The console opens by itself below the editor with the message and the offending line. Click the message and the cursor jumps straight there.
- Edited the code? The button turns into Update on Chart. If the editor's code is identical to what's already running, it shows "On chart ✓" and stays disabled, since there's nothing new to apply.
- Switched assets or timeframes? The indicator follows along and gets recalculated automatically over the new context's candles, same as the native ones.
Step 5: Configure without touching the code
Remember the input.int on line 2? Close the editor, go back to the indicators panel and click the Settings gear next to your script (on the SCRIPTS tab or in the panel's list of added indicators):
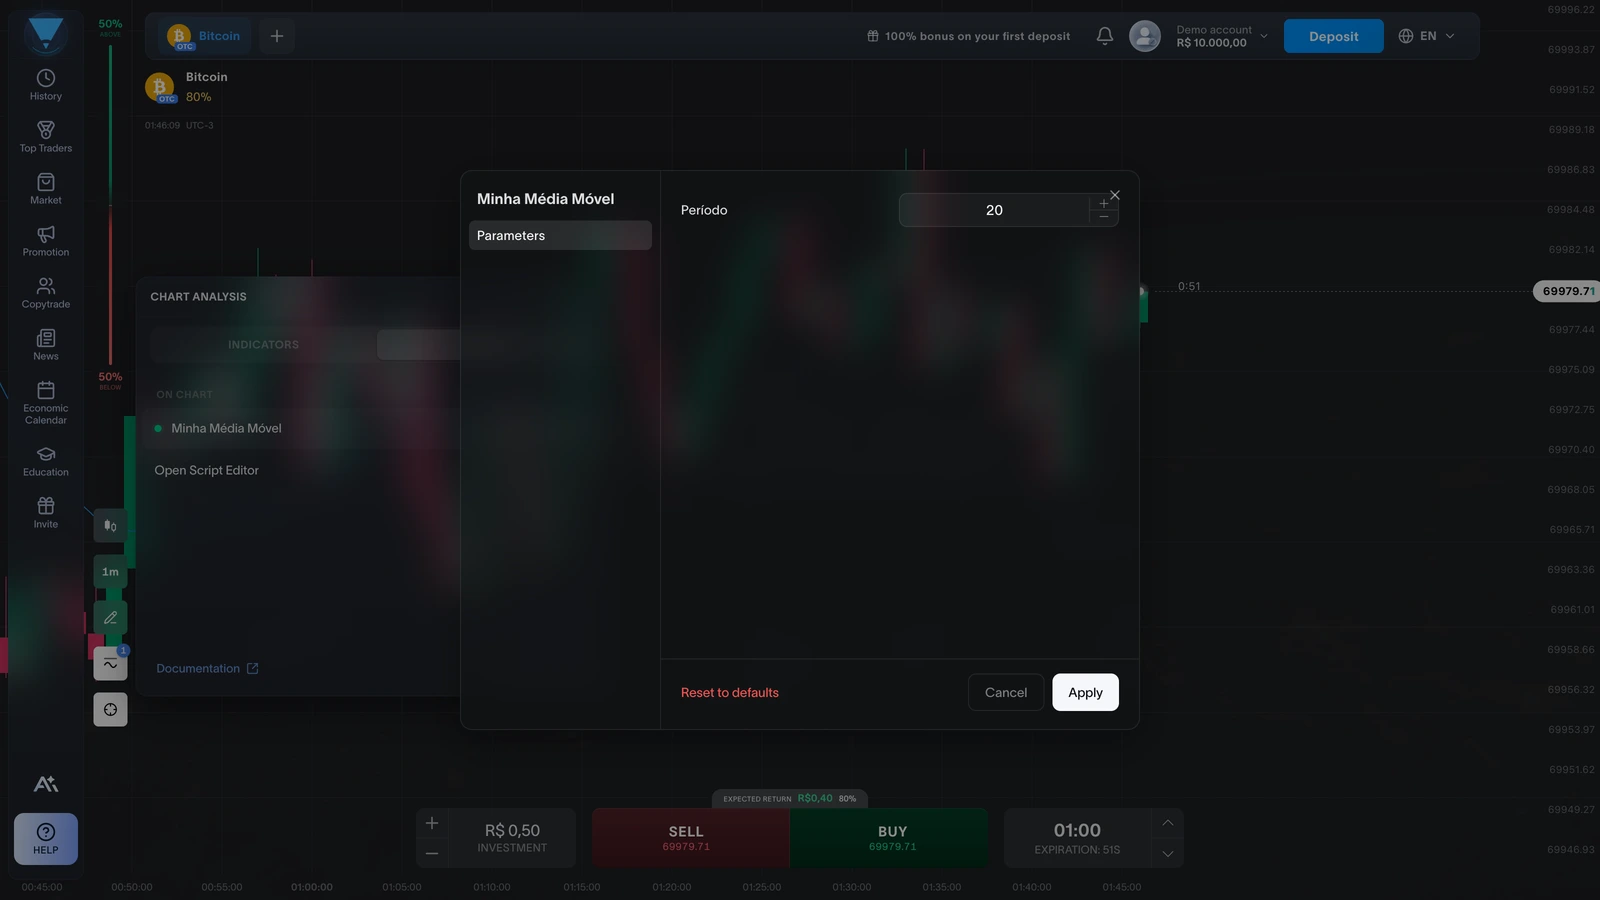
The Settings modal lists everything you declared with input.* in the code. In our case, just "Período". Change it from 20 to 50, click Apply, and the chart redraws right away. No opening the editor, no touching a single line.
That's the difference between a rigid script and an actual indicator. Every input.* you declare becomes a configurable field in the interface — a number, a color, an on/off toggle. Whoever uses your indicator (including you three months from now, remembering nothing about the code) adjusts everything from there.
Step 6: Save and manage
Click Save in the toolbar (or Cmd/Ctrl+S). The script goes into the Saved Scripts list in the sidebar:
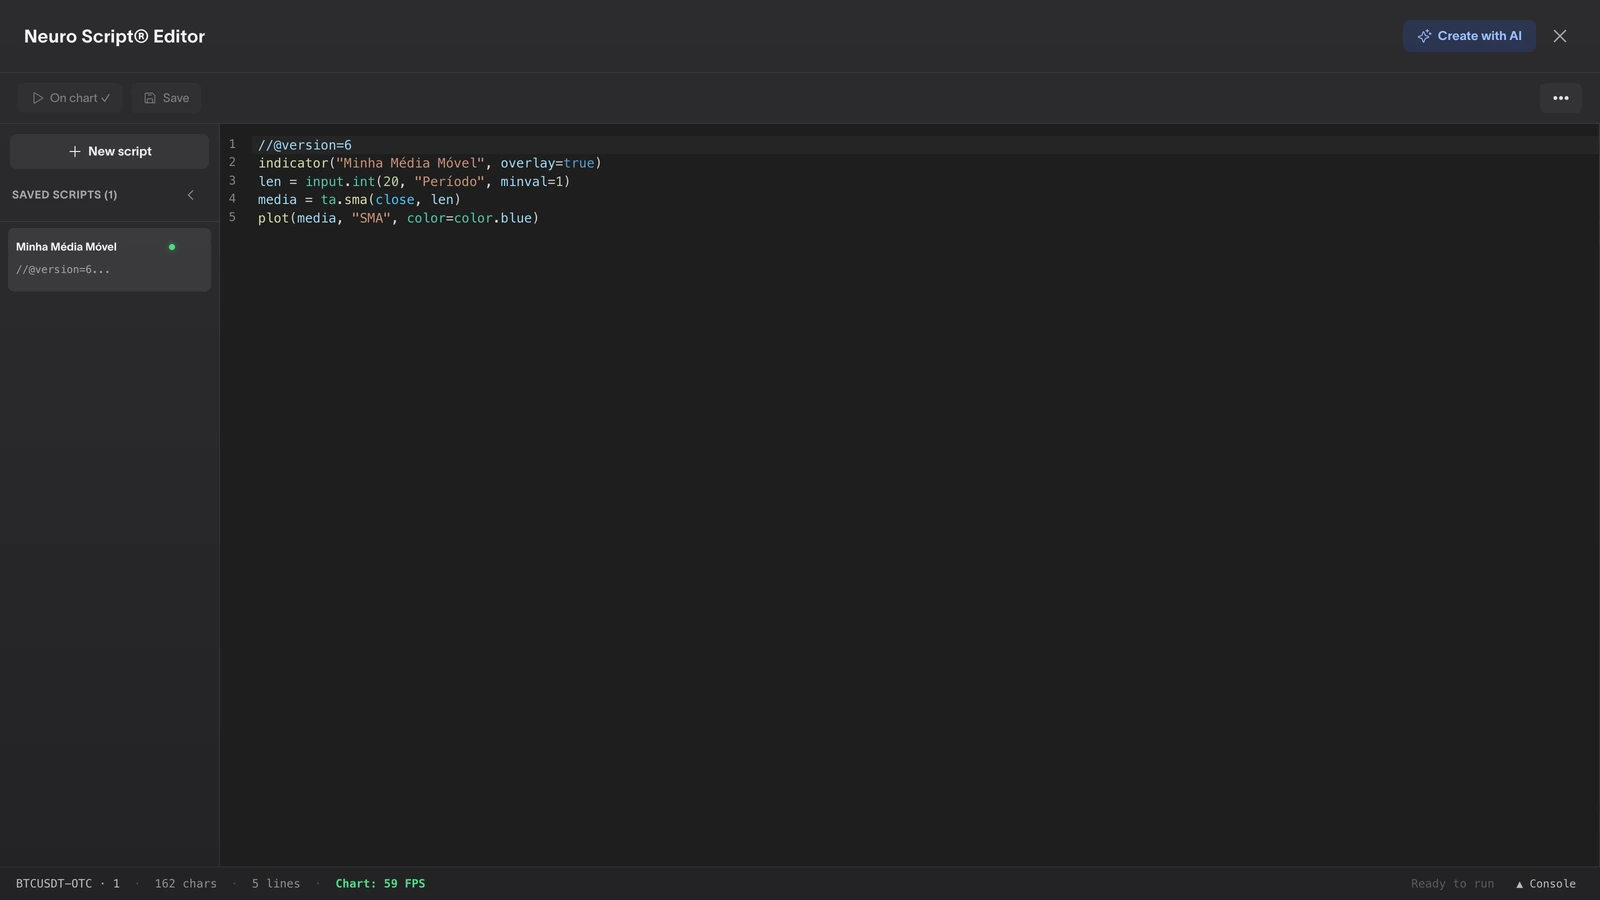
In the list, the script currently drawn on the chart shows a green dot. To manage things:
- Load — click the script. If the editor has unsaved changes, it asks for confirmation before discarding them.
- Rename — the pencil icon next to the name.
- Export/Import — in the toolbar's "⋮" menu, as a
.nsfile. Useful for backups, or for sending a script to someone. - Hide from the chart — in the indicators panel, the Hide (eye) icon hides the script without removing it. The code stays saved.
Don't want to write code? Ask the AI
The Create with AI button at the top of the editor opens the FUTURA AI modal. You describe the indicator in plain English ("RSI with overbought and oversold alerts") and get the NeuroScript code ready to go, with a chart preview before you apply it:
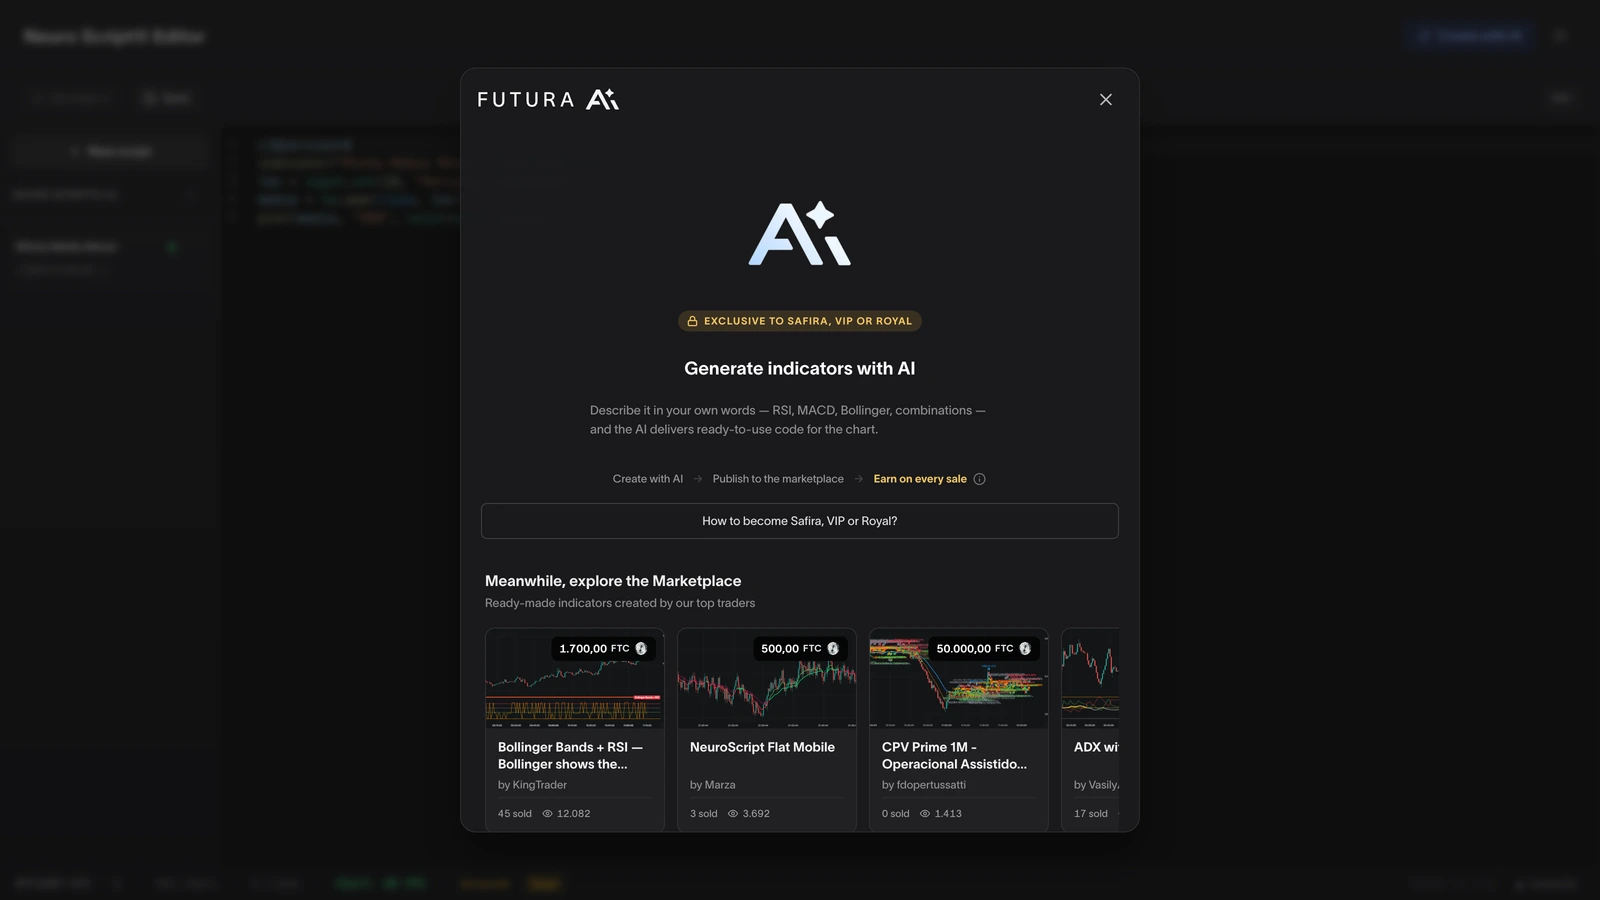
The two paths feed each other. The AI is fast; what you learned in Steps 3 to 5 lets you read, adjust and refine what it wrote. The full AI creation tutorial goes deeper into that flow, including refining the code by conversation.
Common errors (and how to fix them)
| Problem | Likely cause | Fix |
|---|---|---|
| I clicked Add and nothing showed up | Without overlay=true, the indicator draws in a separate pane below |
Scroll the chart, or add overlay=true to indicator() |
| Syntax error in the console | Unclosed parenthesis or quote, misspelled function name | Click the error — the cursor jumps to the line; check the name against autocomplete |
| Button shows a dimmed "On chart ✓" | The editor's code is identical to what's already running | Edit something and the button goes back to "Update on Chart" |
| The Settings gear doesn't show my parameter | The value is hardcoded, without input.* |
Declare it with input.int, input.float or input.color |
| I saved over another script's name | Identical names overwrite (with a confirmation) | Change the name in indicator("...") before saving |
Functions to explore next
Your second indicator doesn't have to stop at the moving average. A quick map of what to try:
| Function | What it does |
|---|---|
ta.ema(close, 9) |
Exponential moving average, reacts faster |
ta.rsi(close, 14) |
Relative strength index (0 to 100) |
hline(70, "Overbought") |
Fixed horizontal line, for reference levels |
input.color(color.blue, "Color") |
Configurable color parameter |
input.float(2.0, "Multiplier") |
Decimal parameter, for multipliers and factors |
The complete list, with examples, is behind the Documentation link in the footer of the SCRIPTS tab.
In the end, building an indicator has less to do with memorizing syntax and more with noticing that every line plays a role: identity, parameter, calculation, drawing. Keep those four roles in mind and you can read any script, including the ones the AI writes for you.
If you're still building your technical analysis foundation, the guide to indicators on the chart and the list of the best indicators for binary options come before this tutorial in the natural reading order. And once your indicator gets genuinely good, you can publish it on the Marketplace and get paid for it.
Head to futurabroker.com and open the editor on a practice account. The 5 lines don't take long to type.