Best Trading Indicators 2026
Discover the 5 best indicators for binary options, how to use each in practice, plus exclusive indicators from the Futura Broker community.
You turn on an indicator on the chart, see some colored lines show up… and have no idea what to do with them. Sound familiar?
The problem isn't the indicator. It's that nobody explained to you which indicators actually work for binary options — and how to read each one when it's time to decide between BUY and SELL.
In this article, we get straight to the point: the 5 most effective indicators for anyone trading binary options, with a practical explanation of when to use each. And at the end, two exclusive indicators created by the Futura Broker community that you won't find on any other platform.
What makes an indicator good for binary options
Before you start turning on everything that shows up in the list, understand one thing: binary options have a fixed time. You can't wait for the price to "eventually" go your way. Either it moves within the trade's time window, or you lose.
That's why the best indicators for binary options are the ones that:
- React fast — delays of many candles are no good when your trade lasts 5 minutes
- Give clear signals — none of that "maybe up, maybe down"
- Work on short timeframes — 1 minute, 5 minutes, 15 minutes
- Complement each other — using two indicators of the same type is redundant
If you still don't know how to turn on indicators on the platform, check out the practical indicators guide before continuing.
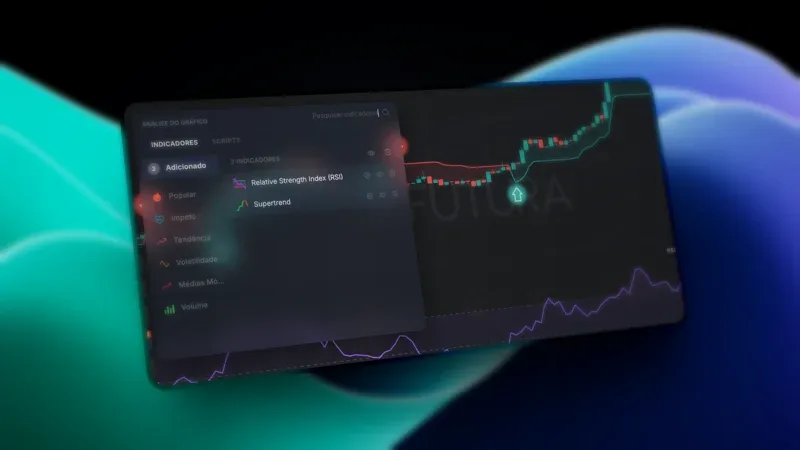
1. RSI (Relative Strength Index)
Type: Oscillator | Best for: identifying overbought and oversold conditions
The RSI measures the strength of a price move on a scale from 0 to 100. In practice, you use it like this:
- RSI above 70 → asset overbought → tendency to drop → consider SELLING
- RSI below 30 → asset oversold → tendency to rise → consider BUYING
Recommended setting: period 14 (default), 5-minute timeframe.
The RSI works best in sideways markets — when the price is oscillating within a range. In strong trends, it can get "stuck" above 70 or below 30 for a long time, giving false signals.
Tip: combine the RSI with support and resistance. If the RSI is below 30 and the price is at a support level, the probability of a reversal increases.
2. Supertrend
Type: Trend follower | Best for: identifying the main direction of the price
Supertrend is the most visual indicator on the platform. It draws a colored line on the chart:
- Green line below the price → uptrend → favor BUYING
- Red line above the price → downtrend → favor SELLING
Recommended setting: ATR 10, multiplier 3 (default).
Supertrend shines in markets with a clear trend. When the price is moving sideways, it can switch between green and red quickly — and that's when you lose.
When to use: look at the 15- or 30-minute chart. If Supertrend has been green for at least 5 candles, drop down to the 5-minute chart and trade only in the direction of the trend (BUY). This is called multi-timeframe analysis.
3. Bollinger Bands
Type: Volatility + Reversal | Best for: identifying price extremes
Bollinger Bands are 3 lines: a middle average and two bands (upper and lower) that expand and contract with volatility.
- Price touches the upper band → it's "stretched" → it may come back → consider SELLING
- Price touches the lower band → it's "stretched" → it may come back → consider BUYING
- Very tight bands → low volatility → get ready for a strong move
Recommended setting: period 20, deviation 2 (default).
Be careful: Bollinger Bands are not an automatic signal. The price can "walk along the band" for several candles during strong trends. Always use it with another confirmation indicator.
4. MACD (Moving Average Convergence Divergence)
Type: Trend + Momentum | Best for: confirming changes in direction
The MACD shows the relationship between two moving averages. It appears as a histogram with a signal line:
- MACD crosses above the signal line → upward momentum → consider BUYING
- MACD crosses below the signal line → downward momentum → consider SELLING
- Histogram growing → trend strengthening
- Histogram shrinking → trend weakening
Recommended setting: 12, 26, 9 (default).
The MACD is excellent as a confirmation. Don't use it alone — combine it with Supertrend or RSI. If Supertrend is green and the MACD has just crossed upward, you have two signals aligned.
5. Stochastic Oscillator
Type: Oscillator | Best for: precise entry timing
The Stochastic works in a way similar to the RSI, but it reacts faster to price changes. It has two lines (%K and %D) that oscillate between 0 and 100.
- Both lines above 80 → overbought → get ready to SELL
- Both lines below 20 → oversold → get ready to BUY
- %K crosses %D from below to above → buy signal
- %K crosses %D from above to below → sell signal
Recommended setting: 14, 3, 3 (default).
The Stochastic is more sensitive than the RSI — it generates more signals, but also more false signals. Use it in combination with another indicator (such as Bollinger Bands) to filter them.
Comparison table
| Indicator | Type | Best scenario | Ideal timeframe | False signals |
|---|---|---|---|---|
| RSI | Oscillator | Sideways market | 5 min | Medium |
| Supertrend | Trend | Strong trend | 5-15 min | Low |
| Bollinger Bands | Volatility | Reversals | 5 min | Medium |
| MACD | Trend + Momentum | Confirmation | 5-15 min | Low |
| Stochastic | Oscillator | Entry timing | 1-5 min | High |
Futura Broker community indicators
Beyond the classic indicators, Futura Broker has something few platforms offer: indicators created by the community using the NeuroScript language.
Any trader can create, share, and use custom indicators. Two highlights:
Fractal Indicator (by Zoni)
The Fractal Indicator V2 identifies reversal points on the chart by marking fractals — patterns where the price makes a local peak or valley. It's useful for finding precise entry points.
In practice, it works like a "map" of where the price has already reversed. Combine it with support and resistance to confirm important zones.
Moving Average Crossover
The Moving Average Crossover automates one of the most classic signals in technical analysis: the crossover between a fast and a slow moving average. When the fast one crosses above the slow one, it's a buy signal; when it crosses below, it's a sell signal.
It's a simple but effective indicator — especially for those who are just starting out and want a clear visual signal on the chart.
Explore more community indicators on the Scripts page.
How to combine indicators
Using a single indicator is like driving while looking only at the speedometer. It works, but you miss a lot of information.
The golden rule: combine a trend indicator with an oscillator.
Combinations that work well:
- Supertrend + RSI — Supertrend shows the direction, RSI shows when to enter
- MACD + Stochastic — MACD confirms the trend, Stochastic provides the timing
- Bollinger Bands + RSI — Bollinger shows the extreme, RSI confirms overbought/oversold
If you want to see these combinations in action with clear entry and exit rules, read the article 3 strategies for binary options in 5 minutes.
Avoid: using two indicators of the same type (e.g., RSI + Stochastic). They'll show the same thing and you won't gain any new information.
Common mistakes with indicators
- Using too many indicators — 2 or 3 is ideal. More than that and you freeze up when it's time to trade
- Ignoring the timeframe — an indicator that works on 15 minutes may not work on 1 minute
- Thinking an indicator guarantees a win — indicators show probability, not certainty
- Not testing on the demo account — always test a new setting on the practice account before risking real money
- Switching indicators all the time — pick a combination and trade with it for at least 2 weeks before changing
For more common mistakes and how to avoid them, see 5 mistakes every beginner trader makes.
Start testing now
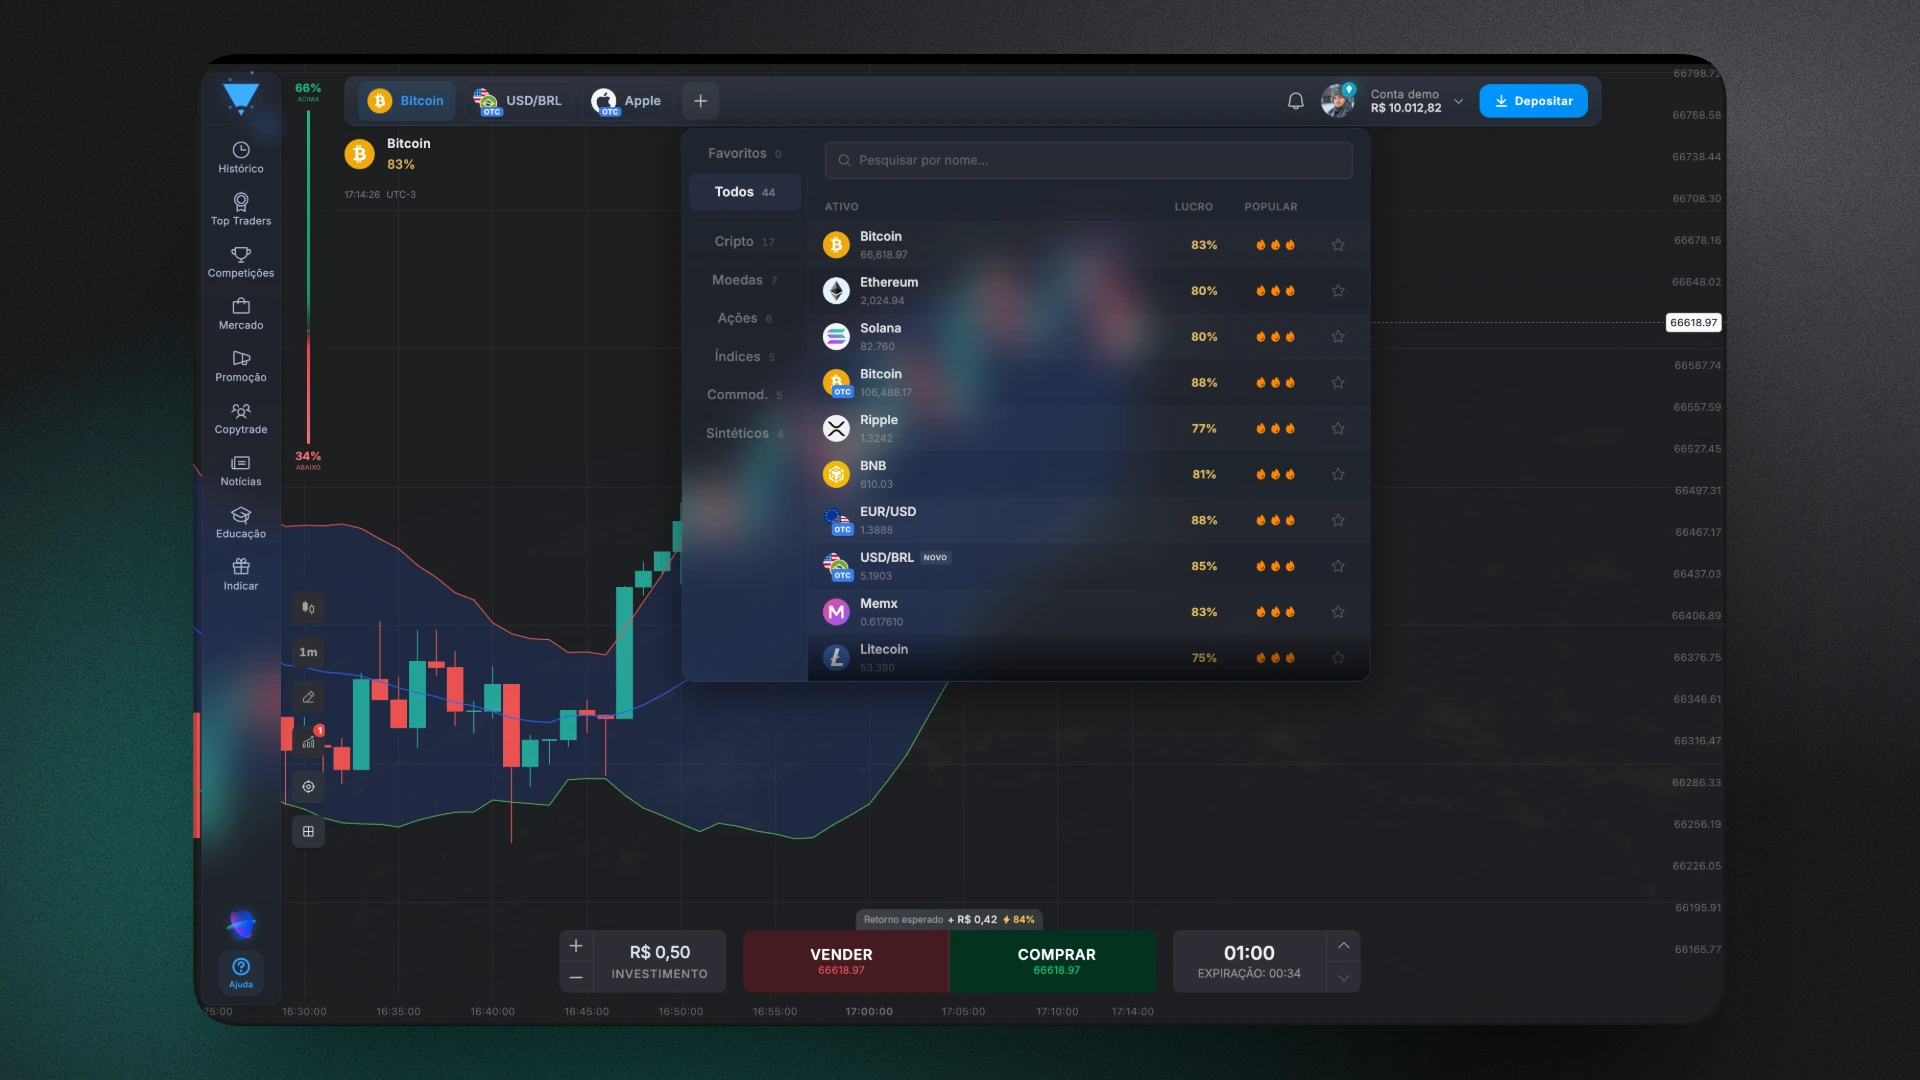
The indicators you've seen here are already available on the platform — including the community ones. The best way to learn is by testing.
Go to futurabroker.com, open the demo account with R$10.000 in virtual balance, and turn on the indicators one by one. No risk, no commitment — just learning.
And if you want to go further, create your own indicators with NeuroScript — the programming language made for traders.